
In my College Preview Magazine each year I devise many different formulas which look at teams that had good or bad fortune the previous year. The charts usually show those teams which had the good fortune generally do not have the same results the following season. We call this method “Slipping and Sliding.” As we noted the last few years in the Turnovers=Turnaround article, results have been even stronger for the NFL than they have for college football. The reason is that there is far more parity in the NFL. In fact, the difference between the best and worst team in the entire NFL is more narrow than the difference between the best and worst team within most college football conferences.
First, I examined how teams fared after making a great improvement the previous year. I charted the NFL teams and noted which teams made the biggest improvement in their record from the previous season. As I expected, the teams that made the biggest improvement generally slide back some the following year. I took a look at the NFL the last 20 years and was very pleased that my hypothisis was confirmed. The 2004 Steelers & Chargers had the biggest improvements from early in my research. Pittsburgh went from 6-10 to 15-1 (+9 wins) while San Diego went from 4-12 to 12‑4 (+8 wins). In the season after their big improvement, the Steelers slid by 4 wins (15-1 to 11-5) and the Chargers by 3 wins (12-4 to 9-7). In 2007 Miami was coming off a 1-15 season and went 11-5 in ’08 (+10 wins). They slid back to 7-9 the next season (-4 wins). Tampa Bay was +7 wins from ’09 to ’10, was #1 on the list and as expected dropped to 4-12 (-6 wins). The great news is was not just teams that had major improvement or decline. Since 2002 any team that improved their record in the NFL the previous year only improved again the next year 66 out of 258 times or 25.6% of the time. On the flip side teams that had a weaker record the previous year only declined a 2nd straight year 62 out of 253 times or 24.5% of the time. More good news news is that teams with just 1 win improvement or 1 loss decline combined to do the opposite 57 of 106 times or just 53.6% which meant much better results the higher you go.
From 2002-2020 there was a total of 137 teams that improved by 3 or more wins compared to the previous season. Of those teams, 113 have seen their record drop or remain the same the following year. Looking at the “Going Down” box below, there are 7 teams from 2021 that had their record improve by 3 wins or more and thus have an 82.4% chance of having the same or a weaker record this year.

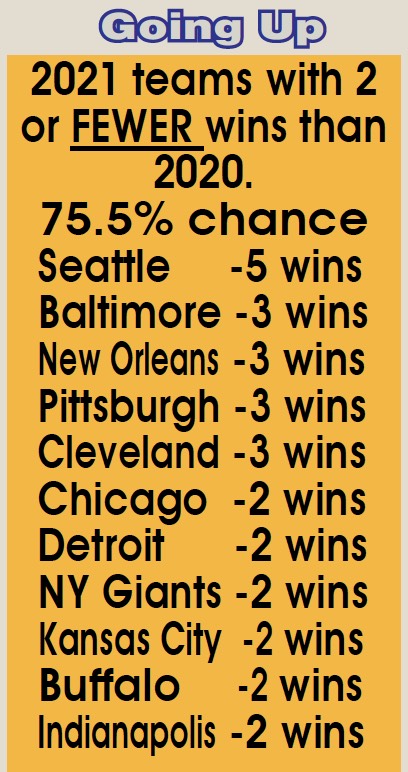
Generally these charts are a two-way street and it has been just as good of an indicator going in the opposite direction. As we did with teams that showed a 3+ game improvement, I took the teams that had 2+ FEWER wins from the previous year and found another great batch of results.
From 2002-2020 there was 198 teams whose win total dropped by 2 or more from the previous year and only 42 of those teams had a weaker record again the next year (21.2%). Of the teams that had a weaker record by 6 or more wins, an amazing 33 out of 37 (89.2%) improved their record. Only 3 teams had a weaker record again, less than 1 out of 10. This year there are 11 teams that fit that box and they had to try real hard to win less games last year as all teams played one extra game!
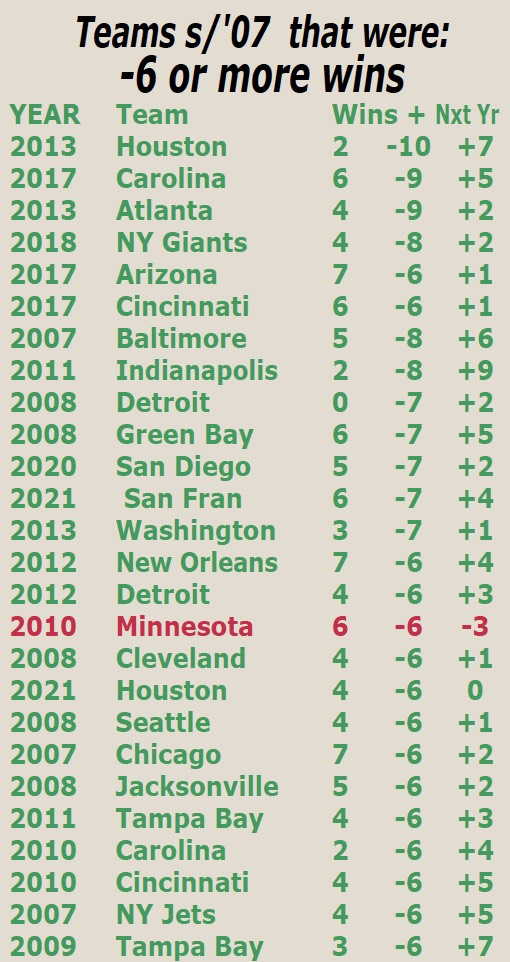
Since 2002, there have been 36 teams on the “Going Down” list that were +6 or more in wins from the previous year and of those 36 teams only TWO managed to improve their records again the next year which is just 5.5% or basically 1 out of every 20. On the flip side, there have been a combined 37 teams on the “Going Up” list since 2002 whose record has fallen by 6 or more wins from the previous year and 33 of those have improved. Only 3 of those teams or 8.1% (1 out of every 12) managed to improve again. Obviously when teams improve a great deal, they find themselves going from one list to the other.
Here are all the teams since 2007 (excluding ’18) that have either improved or worsened by 6 or more wins.
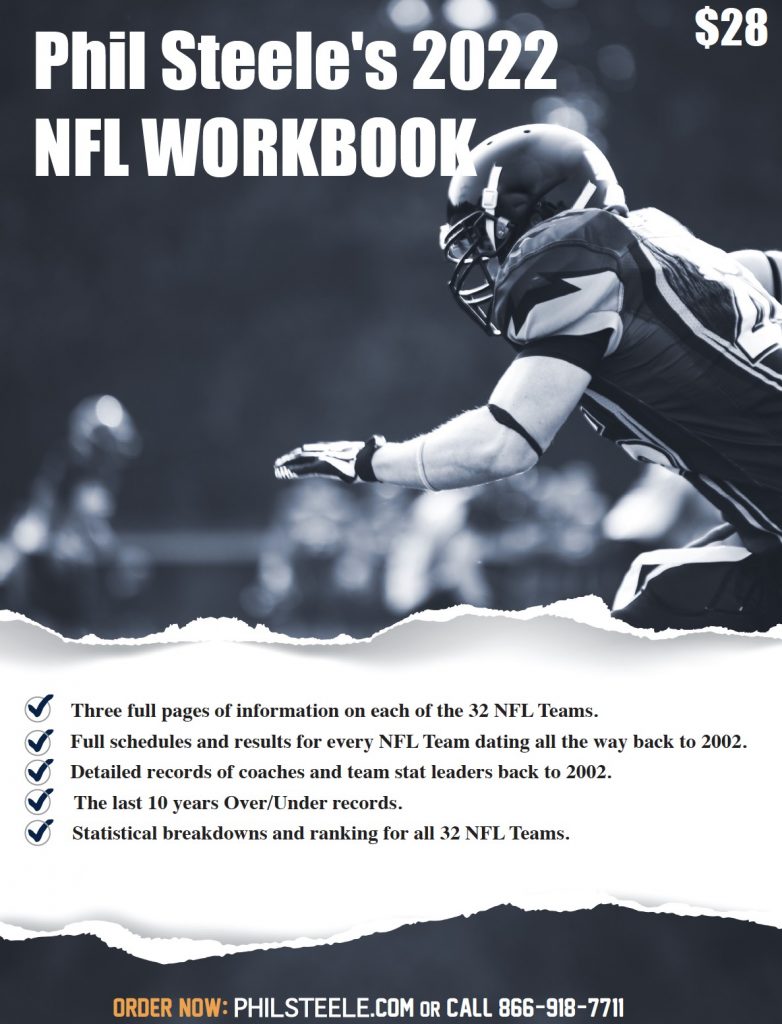
If you love this type of NFL Info make sure you check out the 2022 NFL Workbook.
The 2022 NFL Workbook is available now for Purchase on the Philsteele.com Store. Just $28.
Three full pages of information on each of the 32 NFL Teams. Full schedules and results for every NFL team dating all the back to 2000. Detailed records of coaches and team stat leaders back to 2001. The last 10 years ATS and Over/Under records. Statistical breakdowns and ranking for each 32 NFL Teams.
Here are sample pages from the workbook on the LA Rams.