
If you’ve been reading our College Preview Magazine, you know that every year I look for teams that are much better than their final record would indicate, or those that are much weaker than the final standings would indicate based on the yards per game earned in league play. We only base statistics on league play in the NCAA because teams play non-conference slates of various degrees of difficulty, which affects their overall ypg (yards per game) for the season.
A prime example from 2007 was the Illinois Fighting Illini. We said they were a much stronger team than the final record indicated. The 2006 team was just 1-7 in B10 play, but actually outgained foes by 24 ypg in conference play, which was more indicative of a 5-3 team. Illinois was indeed underrated coming into 2007 and did not disappoint as they finished their season with a Rose Bowl appearance.
In the NFL I look at the entire season since there is more parity and the strength of schedule is fairly even. I devised a system that compares the net wins of a team from the previous season with the team’s net yards per game (ypg) of the previous year. Since we needed some way to translate the ypg into net wins, I determined that every 10 net ypg (+ or -) for a team should translate into one net win (+) or loss (-). As an example: if a team outgained their foes by 320 yards on the year, they would have outgained foes by 20 ypg during the 16 game season, which would work out to an expected 9-7 season. Naturally, since this is a statistical formula based on yards, the numbers do not always transfer out to a true NFL type record. A team could have +0.3 net wins which, of course, cannot happen on field, but the ypg net wins is hypothetical so the numbers can vary.
I went back in the NFL to 2001 and compared what the ypg record would have been vs the actual net win total. Let’s first look at the overrated teams from the previous year and how they fared the following season. The 2001 Bears graded out at -11.8 net wins with the ypg saying they should have been -1.8 wins (-17.75 ypg) and their actual record was 13-3, or +10 net wins. In 2002 Chicago plummeted to 4-12. Another team of note in this section is Philadelphia, which in 2004 was +10 net wins with a 13-3 record. They were only +31.5 ypg (+3.2 wins). That was a 6.8 net win difference and the Eagles had a losing record the next year. Another notable team is the 2003 KC Chiefs, which finished 13‑3 (+10 net wins) but only outgained foes by 12.7 ypg (+1.3). They dropped by 6 net wins the next year to 7‑9.
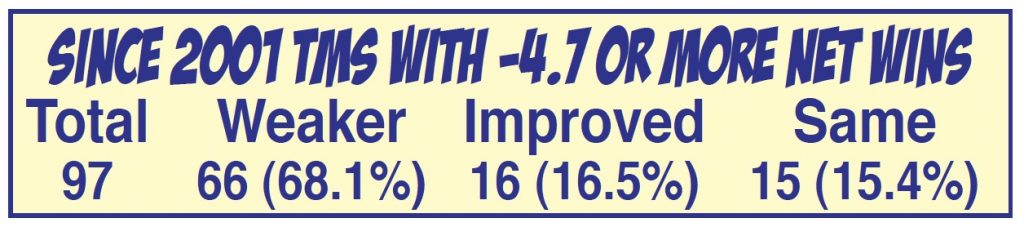
Here are the teams that overachieved relative to their yards per game last year. These teams have a 68.1% fo a weaker record and a 85.4% chance of not improving their record this year. I did include a -4.1 and -3.1 in the box.
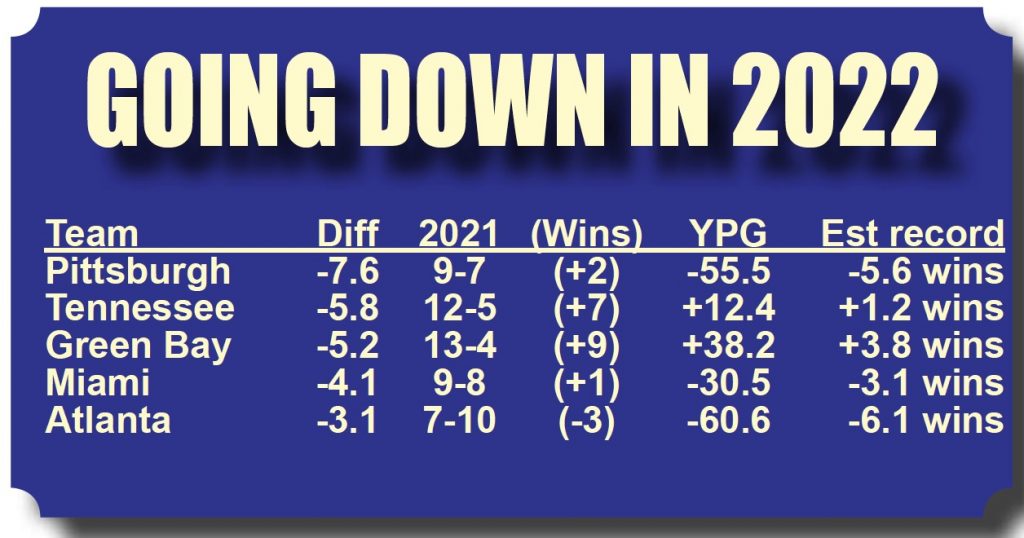
Last year this chart performed amazingly. There were 13 teams that graded a -0.9 or lower and of those 12 teams 10 had a weaker record, one the same and only 1 managed to improve from 11-5 to 12-5 thanks to the extra game. That is why I included the -4.1 and -3.1 teams in this years chart.
From 2001 to 2021, many teams in the NFL were much stronger than their final record. The team that had the most glaring difference was the Cincinnati Bengals of 2002, who finished just 2-14 but were only outgained by 60 yards on the season or 3.8 ypg. Using our ypg system to determine their net wins for the season, the Bengals should have been -0.4. When subtracted from their -12 net wins, they were 11.6 net wins better than their actual record. The next year the Bengals actually showed that improvement on the field by gaining +6 net wins. Another example was the 2005 New Orleans Saints, who finished just 3-13 on the year or -10 net wins. The 2005 Saints actually outgained foes by 37 yards or 2.3 ypg. Using our ypg system, the Saints should basically have been an 8-8 team or +0.2 net wins. The difference between their actual net wins and the ypg net wins was 10.2. In 2006 the Saints were the most improved team in the NFL winning 7 more games! In 2008 the top team on this list was the Miami Dolphins. Miami was 1-15 in 2007 for -14 net wins despite being outgained by only 54.7 ypg (-5.5 wins). In 2008 they finished +10 net wins from the year prior and won the AFC East. In 2009 the top team was New Orleans. The Saints had been 8-8 in 2008 but outgained foes by 71.2 ypg which translates to +7.1 wins. In 2009 New Orleans had a dream season culminating in their first Super Bowl Championship. In 2014 Houston had one of the highest numbers ever in this category. They incredibly outgained their opponents by a combined 475 yards in 2013 (+29.7 YPG). That translates into a 9-7/10-6 type season but the Texans had the worst record in the NFL at 2-14 (-12 net wins) and in ’14 went 9-7 or a +14 win differential. Last year was amazing as there were 15 teams that rated +0.1 or higher and 12 improved their record while the other 3 were the same!
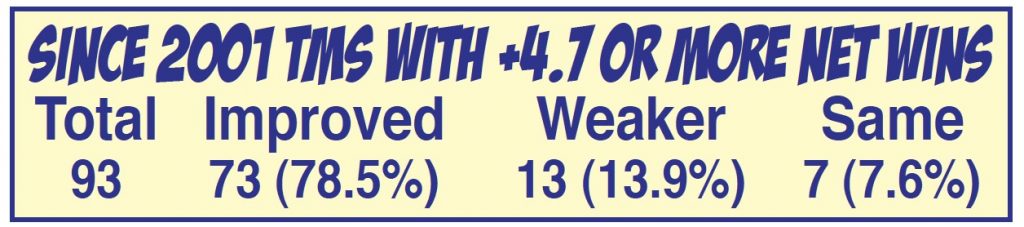
Here are this year’s teams that were much better than last year’s final record would indicate. I did inlclude a +3.9, +4.1 and +4.3 in the chart.
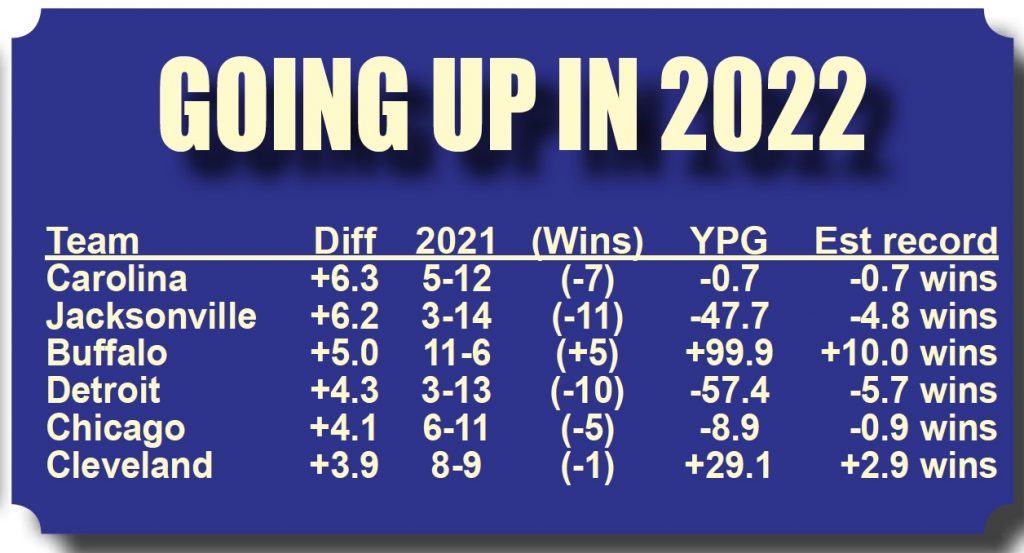
Due to last years success I have included five teams on the chart despite the fact that 4.7 is the cut off for the above records. It is interesting to note that a team like Buffalo made the chart as they were 11-6 (+5) last year but actually outgained foes by 100 yards so should have been +10 wins. The teams that were close but did not make the chart were Denver (+3.4), Baltimore (+2.5), NY Giants (+2.2) and the LA Chargers (+2.0).
If you love this type of NFL Info make sure you check out the 2022 NFL Workbook.
The 2022 NFL Workbook is available now for Purchase on the Philsteele.com Store. Just $28.
Three full pages of information on each of the 32 NFL Teams. Full schedules and results for every NFL team dating all the back to 2000. Detailed records of coaches and team stat leaders back to 2001. The last 10 years ATS and Over/Under records. Statistical breakdowns and ranking for each 32 NFL Teams.
Here are sample pages from the workbook on the LA Rams.