Much like a stock broker, our job is to find value. As with every article, the trends we’ve discovered in college football translate well to the NFL and it is no different when a professional team is coming off a season with multiple net close wins or net close losses.
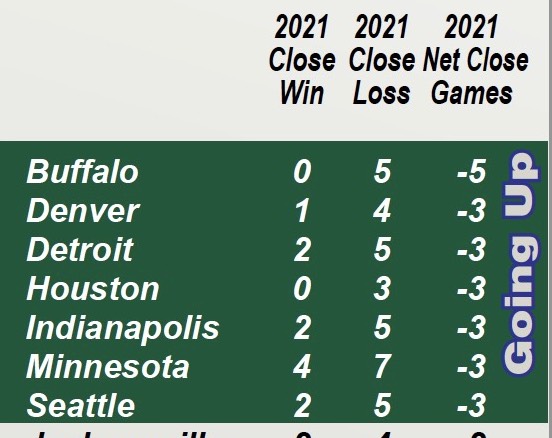
We use a touchdown or less as a base for our calculation of a “close” win or loss, because if a team won or lost by a touchdown or less, they were usually just one play away from a different outcome. There are instances in which a game would be added or deleted. An example is if a team trailed by 13 points and scored a td on the final play, they were never within “one play” of winning. We also use the term “net” close games, which takes the close wins minus the close losses for a final “net” number. As an example, last year the Detroit Lions had 2 close wins and 5 close losses finishing with -3 “net” close games. Conversely, the Pittsburgh Steelers had 7 close wins and 1 close loss finishing with +6 “net” close games.
In the FBS, when a team had 2+ net close losses, they were more fortunate in the following season. In fact, in the last 21 years there have been 557 FBS teams in this category and 75.0% have had the same or better record the next year. As that number increases from two, the percentages improve. To illustrate, 95 teams from that same time span have had 4+ net close losses with 89.5% having the same or better record the following season.
We then looked at how college teams perform the season after having multiple net close wins. In the last 21 years, 582 teams have had 2+ net close wins, with 73.7% having the same or weaker record in the following season. The more net close wins a team had, the higher chance of a weaker record: teams with 4+ close wins have had a weaker or the same record 95 of 114 times or 83.3%.
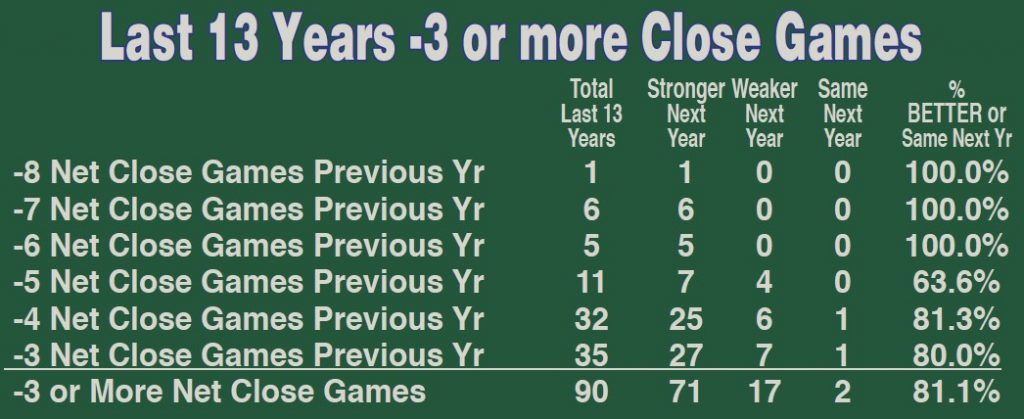
We were excited to translate this to the NFL. Originally we started using -2 or more net wins, but the results weren’t overly illustrative in the NFL so we changed the baseline to -3 or more. Since 2008 there have been 90 teams that were -3 or more net close wins (more close losses than wins) with 73 having posted better or the same record (81.1%). The ’19 Chargers and Bengals became just the 5th and 6th team over the last 13 seasons to have -7 or more net close games.
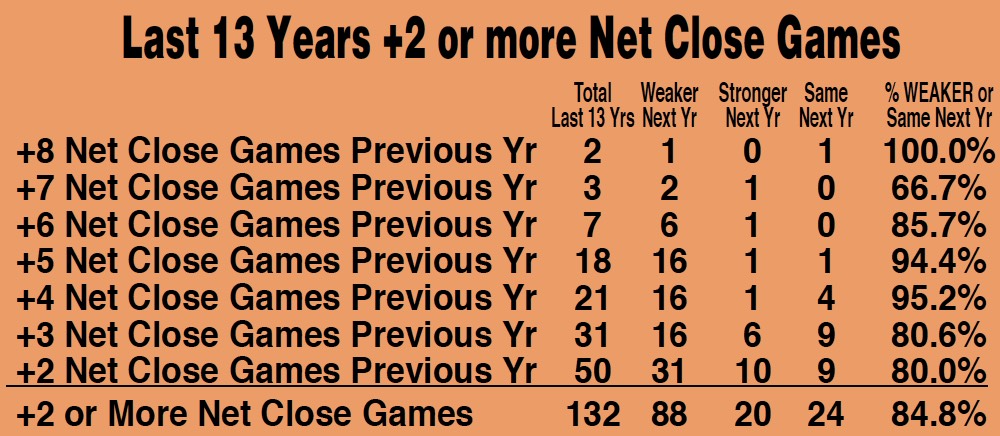
When looking at teams that were +2 or more net close games (more close wins than losses), it’s occured 132 times the last 13 seasons. Out of the 132 times, 88 times the team’s record was weaker (66.7%) while being weaker or the same 84.8% of the time. Last year Cleveland came in with +5 net close wins, meaning they will have a 85% chance of having a weaker or the same record than ’20. They went from 11-5 to 8-9 moving that mark up to 84.8% heading into 2022.
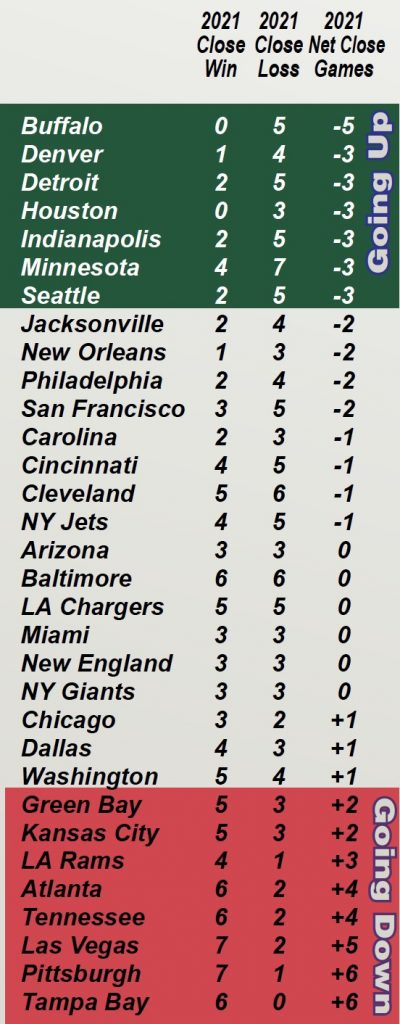
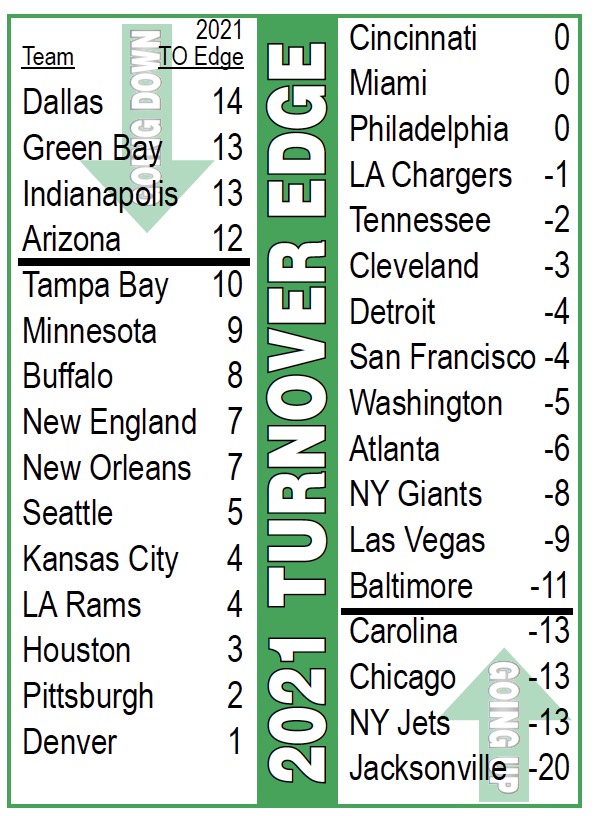
Heading into 2022, there are 7 teams landing on the “Going Up” box (improved record 81% of the time) and 8 on the “Going Down” box (worse record 85% of the time. Check back with us again next year to see if our Close Wins/Close Losses have another successful campaign!
Here is the Full Chart for NFL Close Wins/ Close Losses.
If you love this type of NFL Info make sure you check out the 2022 NFL Workbook.
The 2022 NFL Workbook is available now for Purchase on the Philsteele.com Store. Just $28.
Three full pages of information on each of the 32 NFL Teams. Full schedules and results for every NFL team dating all the back to 2000. Detailed records of coaches and team stat leaders back to 2001. The last 10 years ATS and Over/Under records. Statistical breakdowns and ranking for each 32 NFL Teams.
Here are sample pages from the workbook on the LA Rams.