Tweet
On every right-hand team page in the magazine, I list that teams’ current home power ratings. These home ratings go from a low of two points to a high of six points. I have nine sets of power ratings and this is the adjustment I give to the home team.
Is home field really an advantage? As I mentioned I have a large difference of the adjustment I give to the toughest home teams versus the teams’ with very little home edge. Over the past three years the 130 FBS home teams have compiled a record of 1544-909 in home game for a winning percentage of 62.9%. Over the last five years the record has remained consistent with FBS teams having a combined 2532-1537 62.2% edge. This is the 25th year of the magazine and there has never been a year in that span where home teams won under 50% of their games.
This is a five-part series and I will go thru all of the factors that I use to determine my current home power rating number for each team. Those five factors that I look at are:
- Straight Up Home Record last year, last 3 years, last 5 years.
- Average Attendance for each school and percentage crowd is of the stadium.
- My home and away Game Grades for each team for current year, 3 year and 5 year ATS Record last year, last 3 years, last 5 years average.
- ATS Record last year, last 3 years, last 5 years average.
- My personal influence. Sometimes it is not the size of the crowd but the loudness and intensity of the crowd during the game. Other factors I use my personal judgment are would be altitude and travel time.
There were 17 teams last year that went undefeated at home straight up in 2018 but Las Vegas has a way of evening things out. Only one team was undefeated at home in 2018 ATS and that was Utah State and they were 5-0-1 ATS. Ten teams finished with just one ATS loss at home last year and the most impressive was probably Kent State which was 1-4 Straight up at home but 4-1 ATS. Vegas will make it tougher for teams that win a lot at home to cover and I will use Boise State as an example. In the eight-year run from 2000-2008 Boise St was 50-2 straight up at home and 32-12 ATS as a home favorite making their backers a lot of money in that span playing on the team in Blue uniforms on Blue Turf. The next ten years Boise was an equally impressive 58-5 straight up at home but went 22-40 ATS in those games including 13-31 ATS from 2011-2017
Why do I factor in the spread records? A team should be impressive in their home wins. If a team plays 6 cupcakes and beats those teams by 3 to 7 points per game despite being favored to win big, those would not be impressive wins. On the flip side if a team is playing teams like Alabama and Clemson at home and their home edge had them taking those games to the wire that would be impressive even if the home straight up record was not.
With that said, I will drop in the last three years spread records for each team. UAB has only played football two of the last three years but is a super impressive 10-1 ATS at home the last two years. Fresno State used to have one of the best home field edges and since Jeff Tedford took over, they are 13-4 ATS at home. Four Power Five teams made the Top 10 ATS. Arizona State which is always tough at night in the desert is 13-6 ATS. Miss St with the home crowd ringing cowbells is 13-7 ATS. Oklahoma is at the very top of the straight up charts and with their high flying offense they score enough to win by more than expected and are 12-7 ATS. Utah has the MUSS Student section and altitude and is also 12-7 ATS. Here is the complete chart.

Three Power Five teams are in the bottom 10 ATS. I am surprised that Kentucky which won double digit games for the first time since 1977 this past year is just 6-15 ATS. Tennessee which is rebuilding again is just 6-15 ATS and TCU checks in a 4-14 ATS.
Now I will take a look at exactly how teams have fared at home over the last five years. I have left out both Coastal Carolina and Liberty.
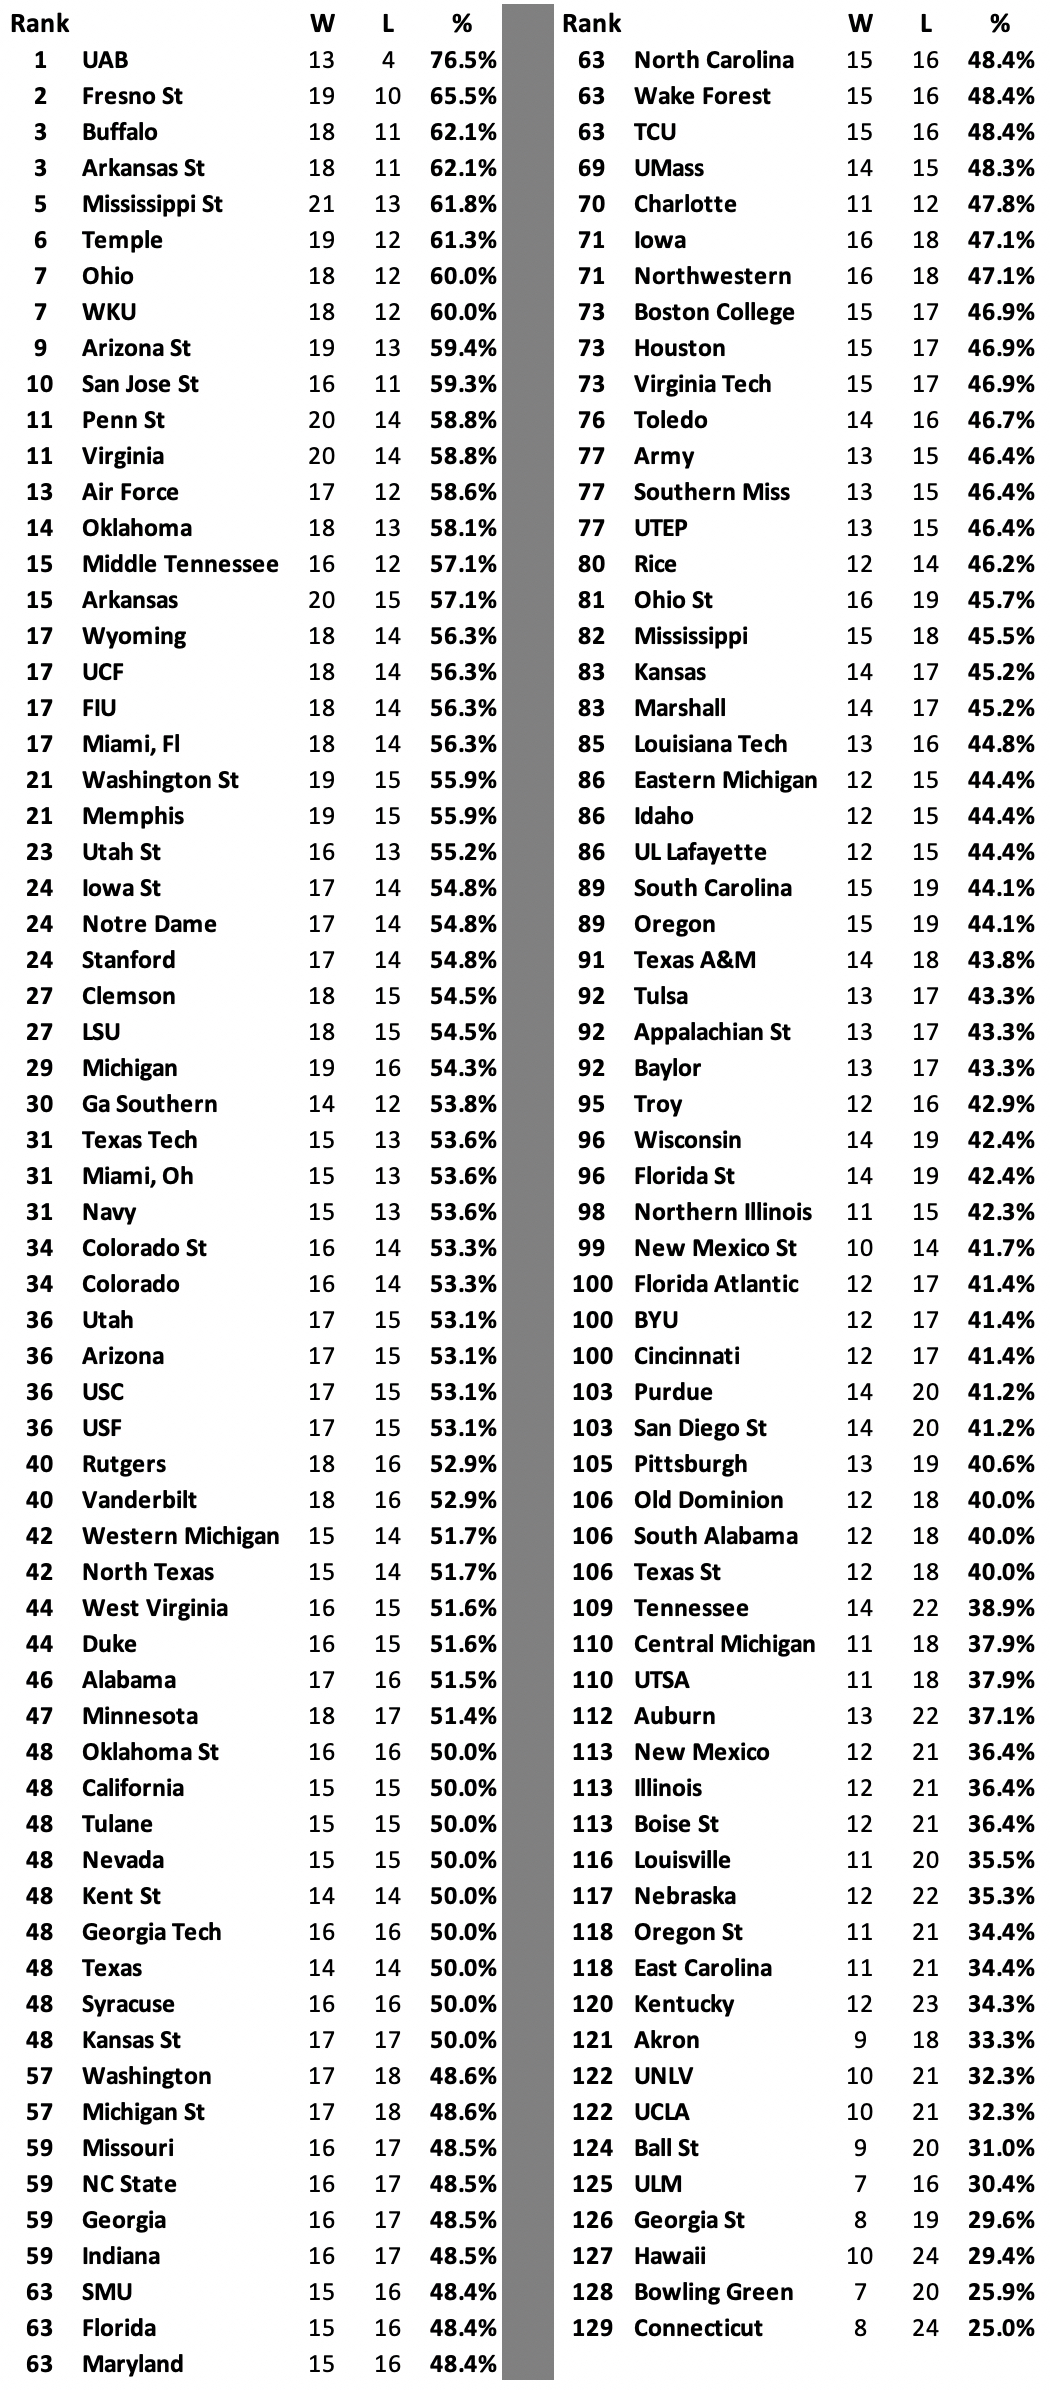
Naturally with the three-year records making up 60% of the five year records numbers we find a lot of similarities to the two charts. Jumping into the top ten are teams like Arkansas St and Western Kentucky who were both 9-3 ATS in 2014-15. At the bottom is Connecticut which was 16-10 ATS from 2010-13 but has been at the bottom the last 5 years at just 8-24 ATS. UCLA is the only Power Five team in the bottom ten as the Bruins are just 10-21 ATS the last five years.
On Wednesday we will finish up with Part V of the Home Field Advantage series.