On every right-hand team page in the magazine, I list that teams’ current home power ratings. These home ratings go from a low of two points to a high of six points. I have nine sets of power ratings and this is the adjustment I give to the home team.
Is home field really an advantage? As I mentioned I have a large difference of the adjustment I give to the toughest home teams versus the teams’ with very little home edge. Over the past three years the 130 FBS home teams have compiled a record of 1544-909 in home game for a winning percentage of 62.9%. Over the last five years the record has remained consistent with FBS teams having a combined 2532-1537 62.2% edge. This is the 25th year of the magazine and there has never been a year in that span where home teams won under 50% of their games.
This is a five-part series and I will go thru all of the factors that I use to determine my current home power rating number for each team. Those five factors that I look at are:
- Straight Up Home Record last year, last 3 years, last 5 years.
- Average Attendance for each school and percentage crowd is of the stadium.
- My home and away Game Grades for each team for current year, 3 year and 5 year ATS Record last year, last 3 years, last 5 years average.
- ATS Record last year, last 3 years, last 5 years average.
- My personal influence. Sometimes it is not the size of the crowd but the loudness and intensity of the crowd during the game. Other factors I use my personal judgment are would be altitude and travel time.
Today I am going to look at my Average Game Grades for each team when they play at home and how much that differs from their road Average Game Grade. Let me first explain what my Average Game Grade is. When I started my magazine, I had developed a formula which matched up the rush offense of one team, versus the rush defense of their upcoming opponent and gave a projected amount of rush yards. I devised the formula for pass offense vs pass defense and points offense versus points defense. This formula than projected the results for the upcoming game. Each teams power rating is not adjusted by the total yards or total points but rather by the difference from what was expected. Let me give you an example of what I mean. If you based it just on the yards gained and adjusted your power rating, then Georgia rushing for 250 yards versus Connecticut would naturally be better than rushing for just 175 yards versus Michigan St. My Power rating system however would grade the performance versus Michigan St as much stronger. Michigan State led the nation in rush defense allowing just 77.9 ypg and 2.58 ypc. My computer would have forecast Georgia to rush for 160 yards vs the tough Spartan rush D. Connecticut was at the other end of the spectrum with their rush D allowing 335 rush yards per game and an amazing 7.67 ypc. Those totals came against weaker rush offenses than Georgia! My computer would have forecast Georgia to rush for 360 rush yards. Georgia rushing for 175 versus Michigan St would have actually raised their power ratings as they exceeded expectations. Rushing for 250 yards vs UConn’s porous rush defense would have lowered their grade by quite a bit.
To get an average game grade I just reversed the formula. I have the opponents’ grades for all the categories and after the game is over, we have the actual stats. I will use some basic numbers to make it simple. If team A has a rush offense of 10 and team B has a rush defense rated at 7, then team A should rush for 200 yards. Now if the game has been played, I just take the opponent rush defense of 7 reverse the chart and say that rushing for 200 yards versus a 7 level rush defense would equate to being a 10 rush offense. I then add up the power ratings of what the team actually achieved and that equates to an Average Game Grade. My average game grades also adds in a home field advantage to the expectation level.
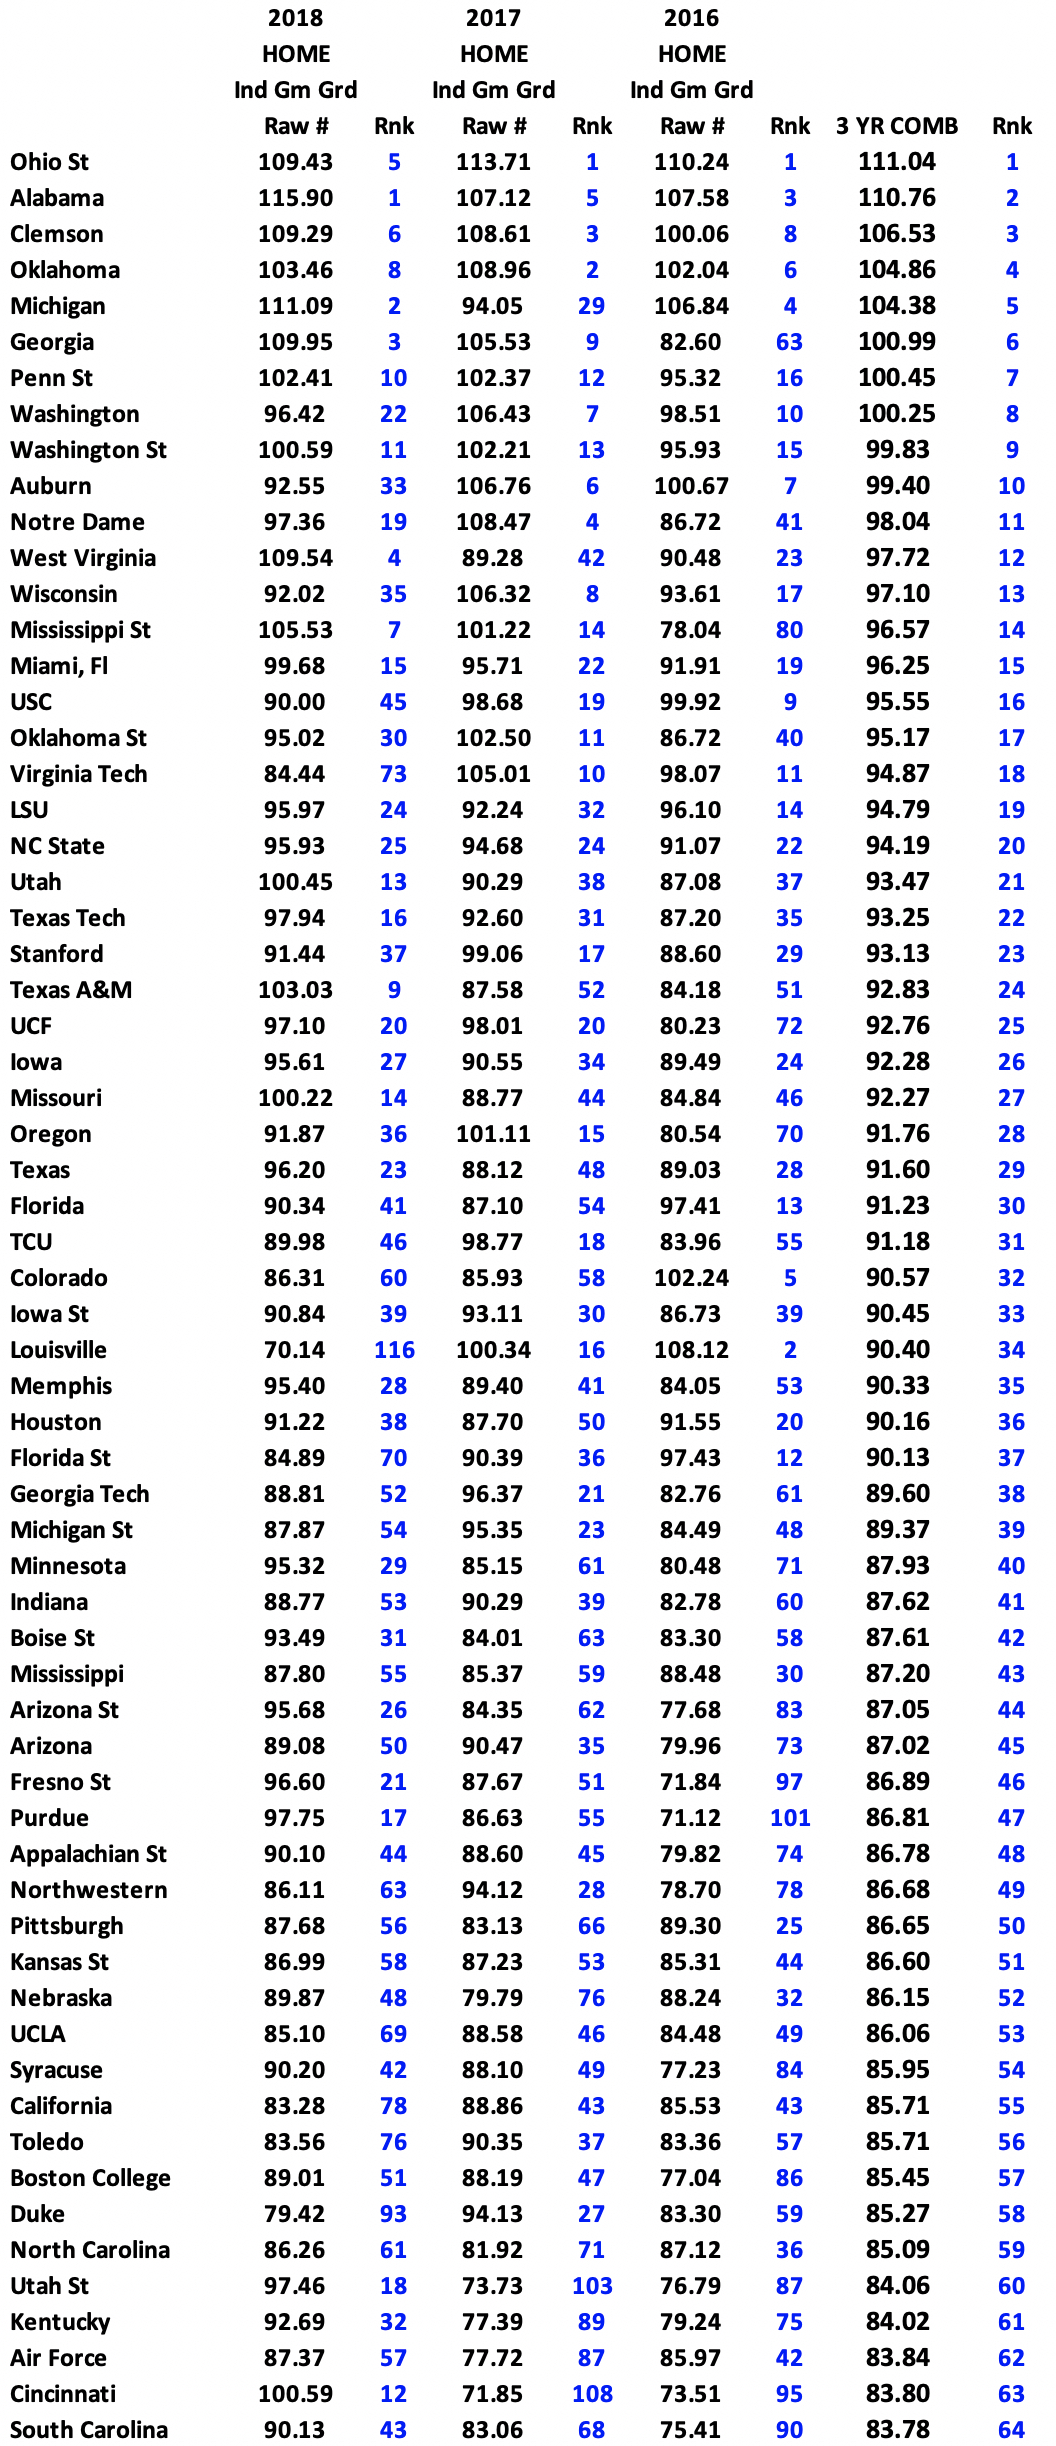
Now that you know what the average game grade is, I will start by showing you what level each team has played to at home the last 3 years. I gave 40% of the grade to 2018, 32.5% to 2017 and 27.5% of the grade to 2016’s Average Home Game Grade.
Ohio State comes up #1 at 111.04 with Alabama at #2, Clemson #3 and Oklahoma #4.
Georgia in 2016 only played to a home average game grade of 82.6 which was #63 but the last two years have been much tougher between the Hedges at #9 in 2017 and #3 last year. Wash State has been ranked #17, #21 and #17 overall in my average game grades but at home have been #11, #13 and #15.
At the bottom end of these rankings are teams that have indeed struggled at home in Texas St, UTEP and Bowling Green. The lowest rated Power 5 team in home games the last 3 years is Oregon State which has played to a level of 72.77 and just above them are Rutgers (73.69) and Illinois (73.74). Here is the complete chart the last 3 years of Average Home Game Grades.

The chart above is only one half of the equation. Last year Alabama played to the top home field Average Game Grade with 115.9 but they would have been at the top or near the top in almost any category any way. They also played to the top Away grade of any team in the country and that was even higher than the home grade at 121.22. Naturally most of the stronger teams will play at a higher level than the weaker teams. To balance it out, I also look at the home and away differences for each team from each of the last 3 years. Here is the chart.
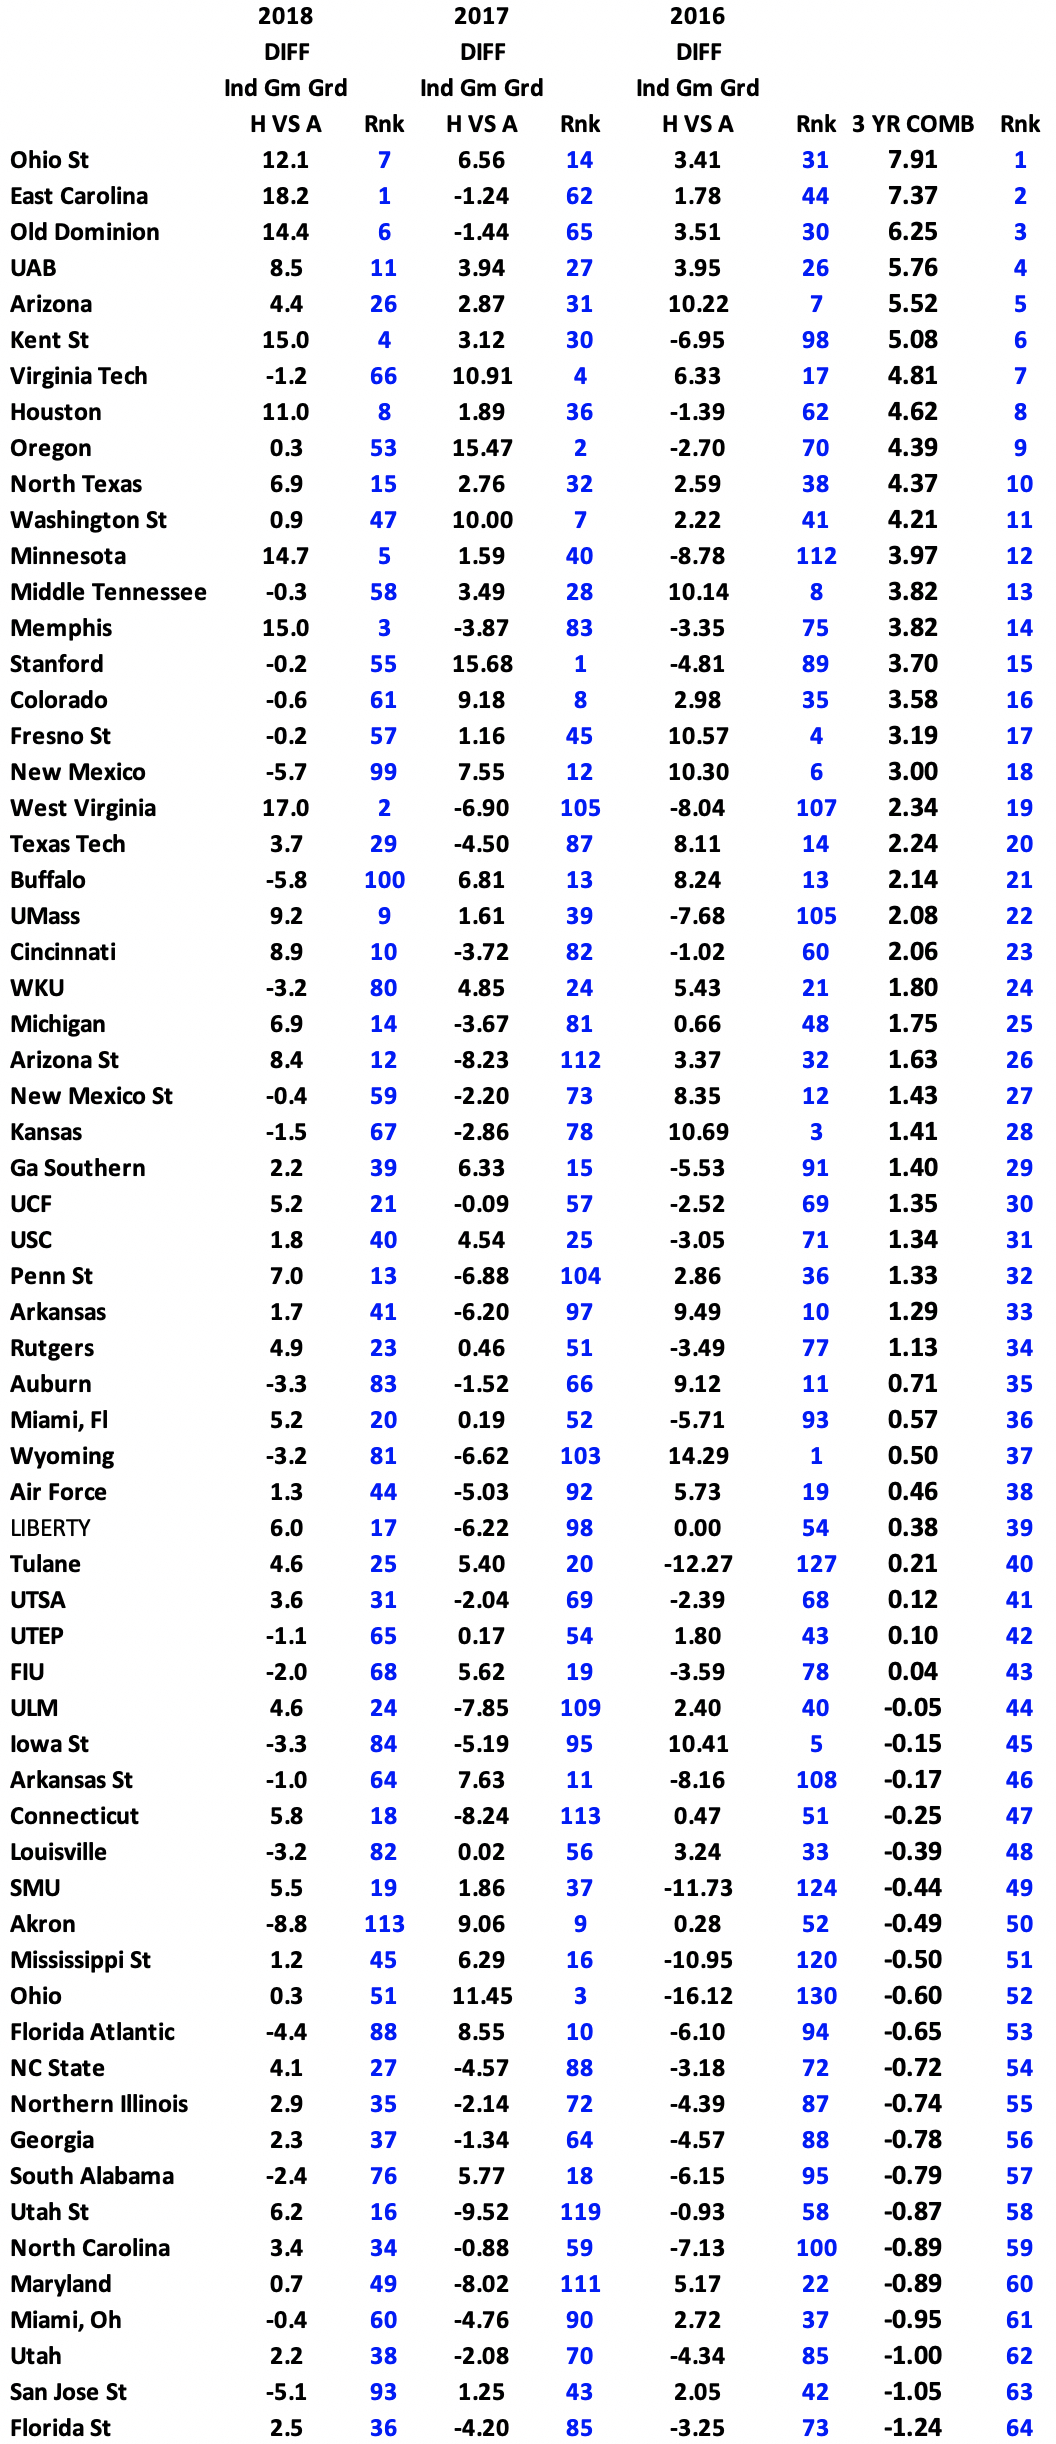
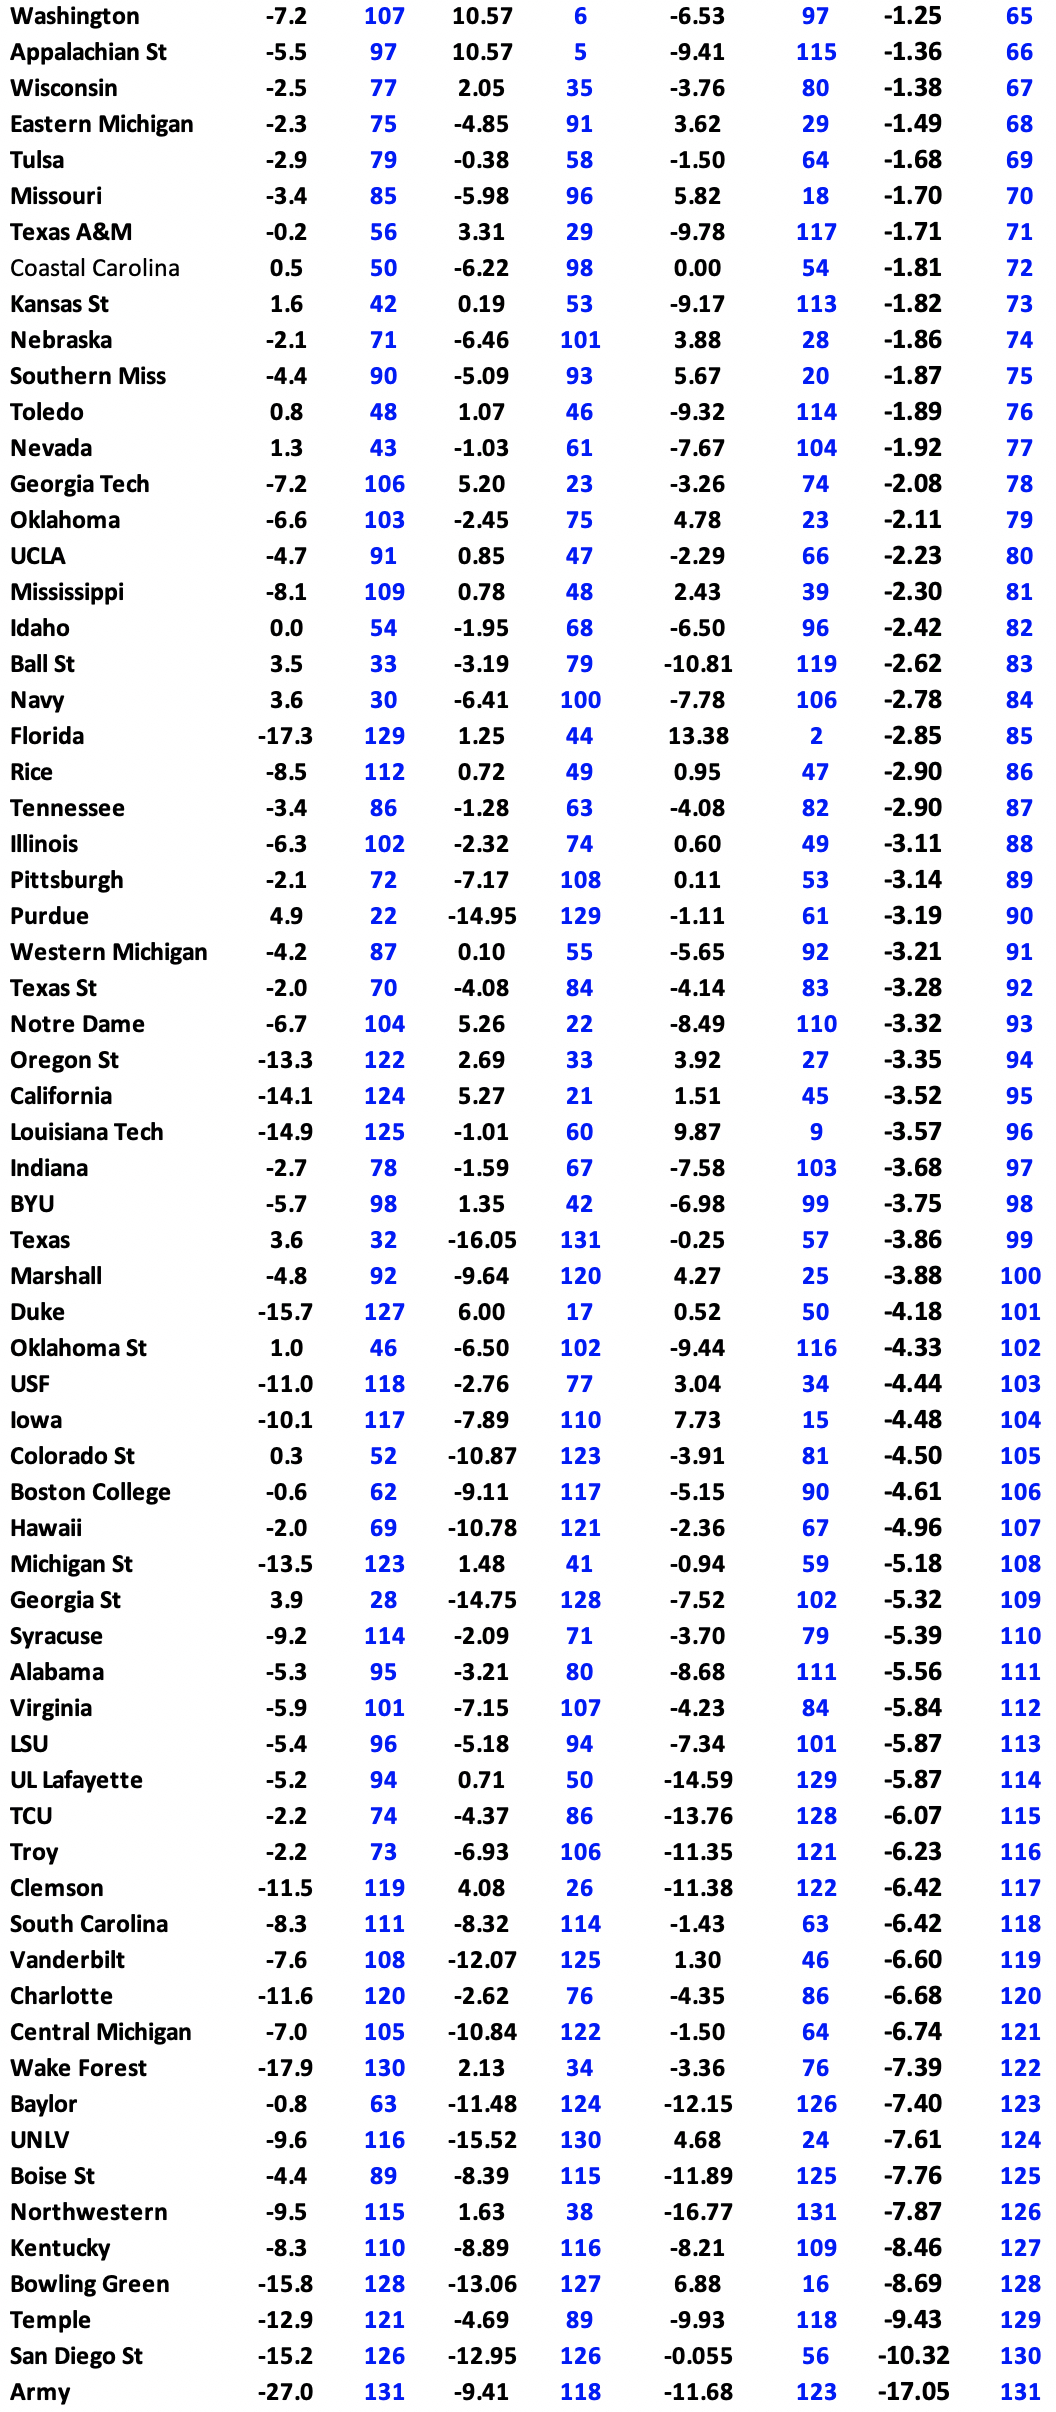
Now the first thing I look at is the #1 team and it surprises me a little. Generally, Ohio State is a big home favorite and many of their home wins are blow outs which can lead to some garbage yards at the end of the game. Also, Ohio State has one of the best traveling fan bases in the country sometimes with their fans outnumbering an opponents’ fans even when on the road. Ohio State plays on the average to a 7.91 higher game grade than they do on the road over the last 3 years. Three Group of Five teams with underrated home fields come up next in East Carolina, Old Dominion, and UAB. Alabama actually plays more inspired on the road in front of enemy fans as they have had a higher Away Average Game Grade all three years and come up #112 on this chart. Last year Army played 27.0 points per game higher on the road than they did at home and that huge number has them #130 in this category over 3 years. At home they outscored teams by just 7 points per game and that included Three teams that were in the FBS in 2017! On the road they took Oklahoma to OT and had a 26-19 FD edge. On the road they outscored their foes by a 40-15 average and that included beating three bowl teams by 29, 15 and 56! Kentucky has actually played to an 8.46 higher average game grade on the road than it has at home over the last 3 years.
For my overall computations I take into account the last FIVE years in each of these categories but that would have been too many numbers to digest for this blog, so I am just showing the last 3 years. In the formula it is always weighted with the current past year getting the largest part of the grade.
Monday I’ll post the ATS Records for last year, last 3 years & last 5 years average.