Tweet
On every right-hand team page in the magazine, I list that teams’ current home power ratings. These home ratings go from a low of two points to a high of six points. I have nine sets of power ratings and this is the adjustment I give to the home team.
Is home field really an advantage? As I mentioned I have a large difference of the adjustment I give to the toughest home teams versus the teams’ with very little home edge. Over the past three years the 130 FBS home teams have compiled a record of 1544-909 in home game for a winning percentage of 62.9%. Over the last five years the record has remained consistent with FBS teams having a combined 2532-1537 62.2% edge. This is the 25th year of the magazine and there has never been a year in that span where home teams won under 50% of their games.
This is the final blog of a five-part series, and I went thru all of the factors that I use to determine my current home power rating number for each team. Those five factors that I look at are:
- Straight Up Home Record last year, last 3 years, last 5 years.
- Average Attendance for each school and percentage crowd is of the stadium.
- My home and away Game Grades for each team for current year, 3 year and 5 year ATS Record last year, last 3 years, last 5 years average.
- ATS Record last year, last 3 years, last 5 years average.
- My personal influence. Sometimes it is not the size of the crowd but the loudness and intensity of the crowd during the game. Other factors I use my personal judgment are would be altitude and travel time.
I have fed all of the data into my computer and received my computers forecast for each teams’ home field edge. I also have a chart which lists where I have ranked each teams’ home edge the last 11 years. A lot of thought went into last years’ home field advantage and in that respect, I am like the Federal Government when it comes to interest rate changes. I usually limit a teams’ home field edge difference to .25 one way or the other. The Feds may note the Economy needs a big correction one way or the other but usually limit it to .25 for an adjustment. There are a handful of teams that may have had a really bad home record six years ago drop off the numbers and the last 5 years have been much stronger than the five year record last year and some teams get adjusted by a full half point from last year but this is rare. The largest changes over the last 11 years belong to Hawaii and Stanford. At one point the travel to the islands made it very tough on opposing teams. From 2006-2010 the Rainbow Warriors were 29-9 in home games. The last six years Hawaii has been just 18-22 at home. Back in 2008 Hawaii had a home field edge of 5.5 in my magazine but has been making a slow turn downwards to 3 last year. After a decent 5-2 record last year, they have bumped back up to 3.25 but that is a difference of 2.25. At the other end of the spectrum is Stanford. Back in 2008 the Cardinal had a home rating of just 2.25 on my scale with their stadium at a low capacity and previous five years they were just 9-22 at home. Enter Jim Harbaugh and David Shaw and the next ten years Stanford was 56-8 at home and the playing to a better percentage of capacity. Their slow steady climb got them to a 5-point home field edge in last years’ magazine. After a below average (for them) 4-2 last year I backed them up to a 4.75 but that is still a 2.5 difference from where they stood in 2008’s magazine.
I talked about some of the factors I use despite the computer’ numbers. Autzen Stadium in Oregon is actually one of the louder venues in the country. If you go just by total attendance last year games in Autzen had an average attendance of 51,588 fans which is just half of what some of the biggest venues have but the noise could be even louder than some. The Blue turf for Boise is a big help for them. I also factor in altitude which is very tough to prepare for in one week. Every coach has a different way to prepare his team for high altitude games.
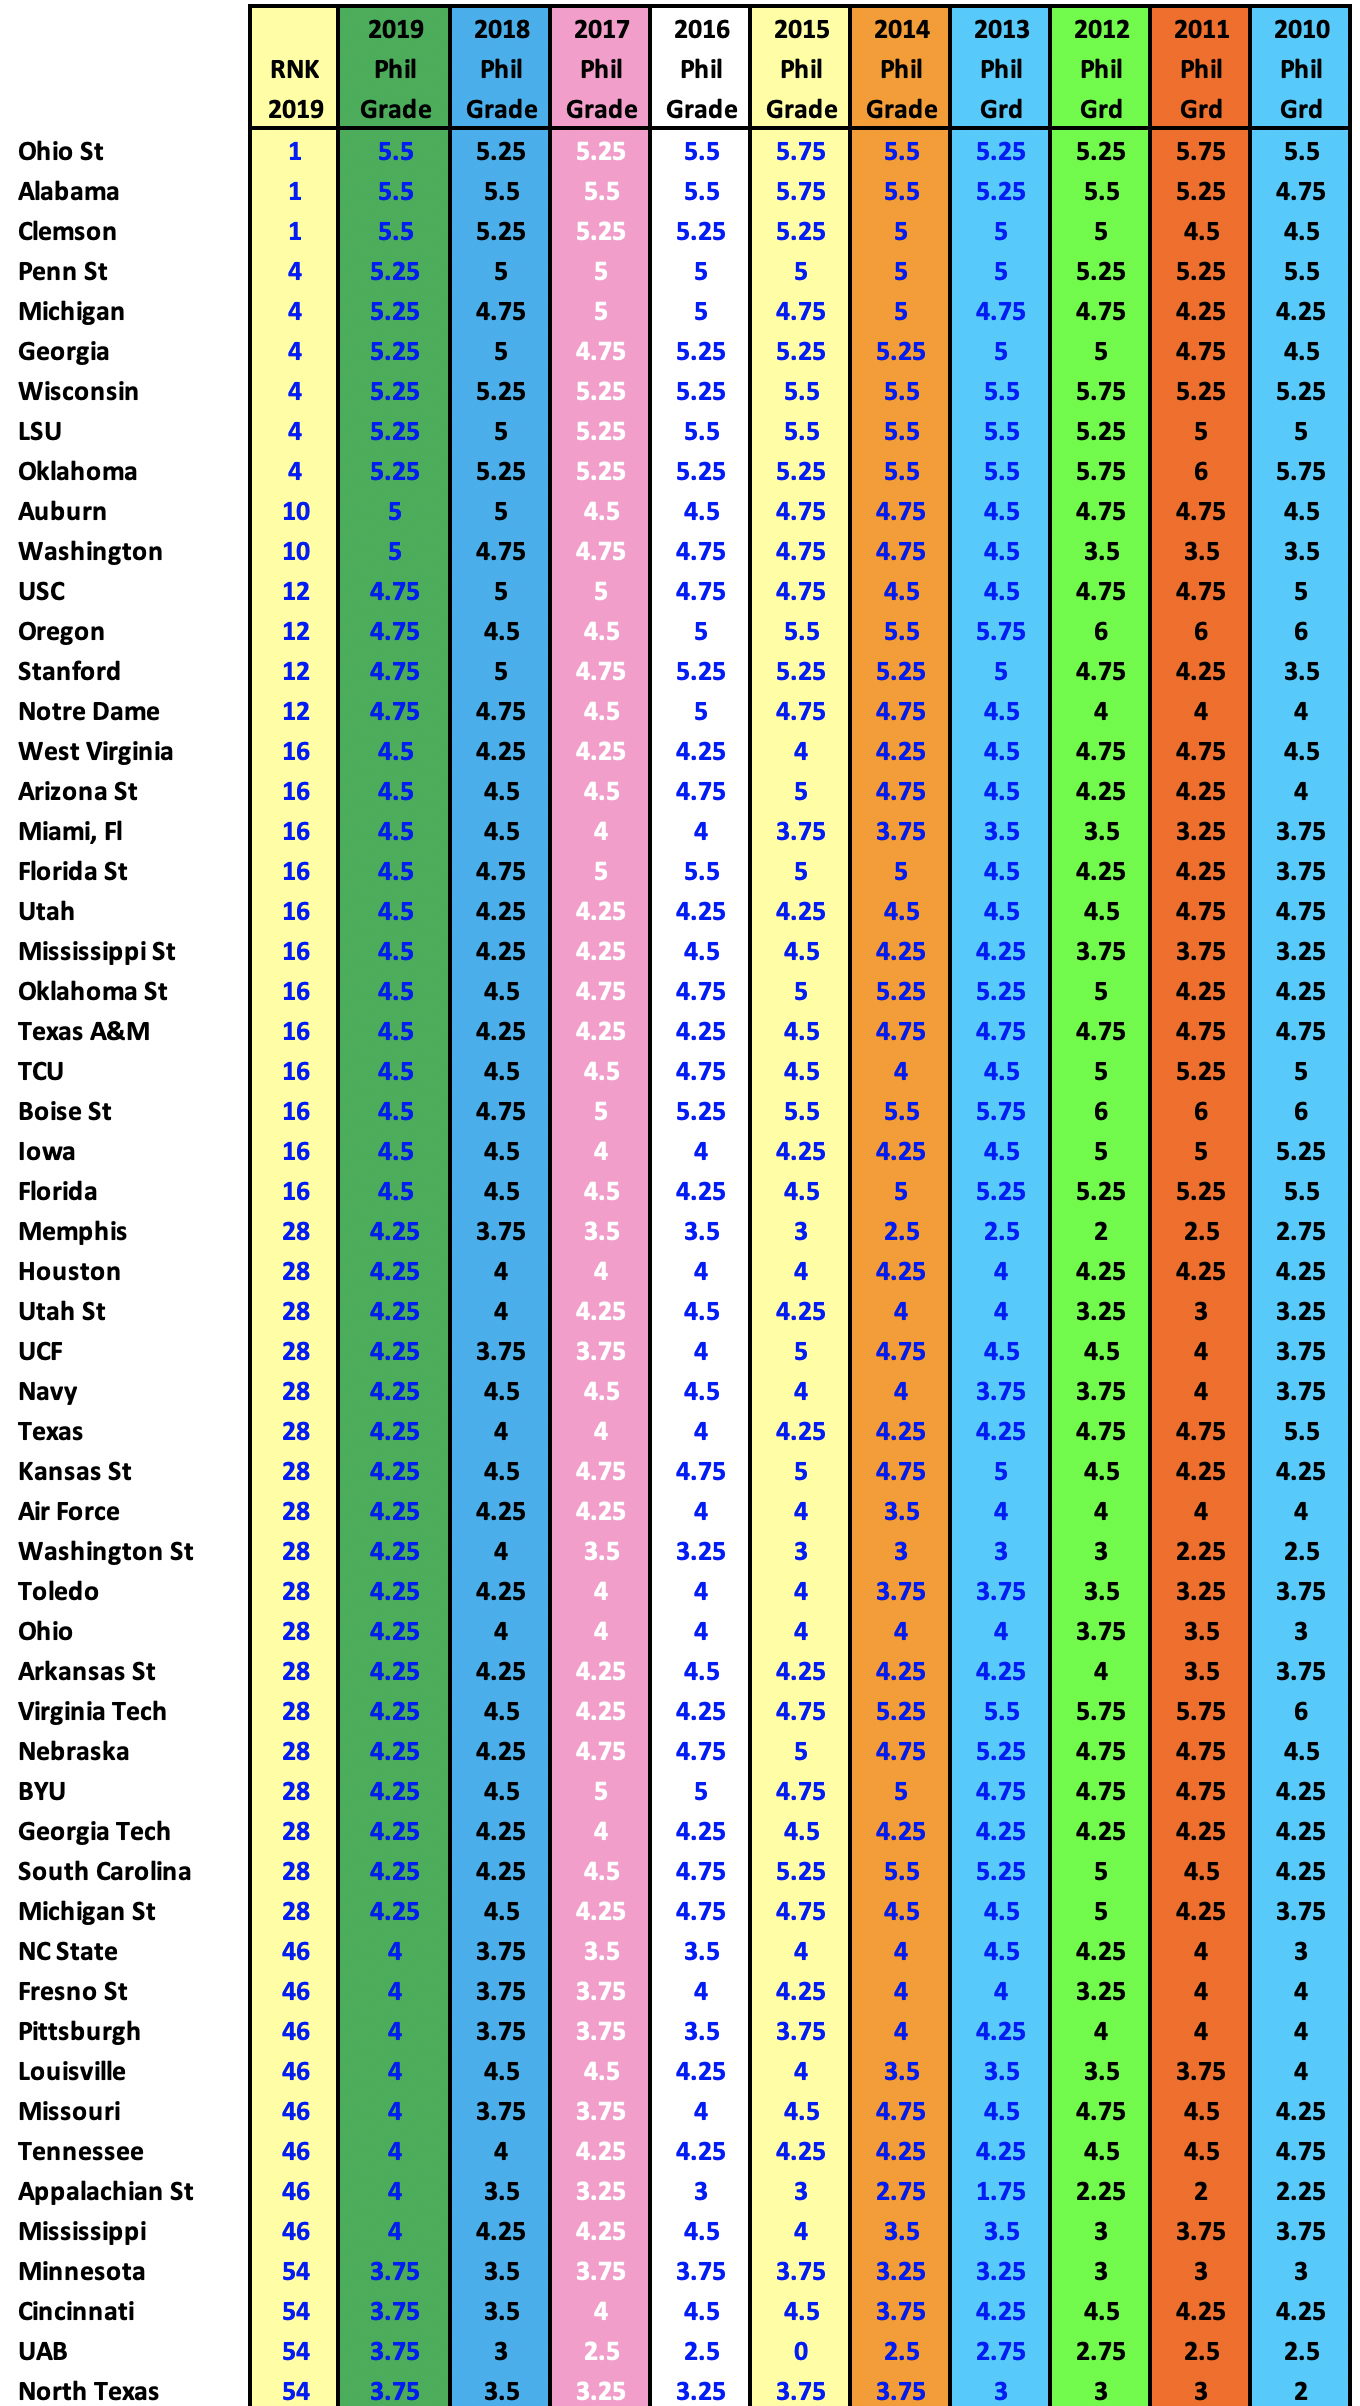
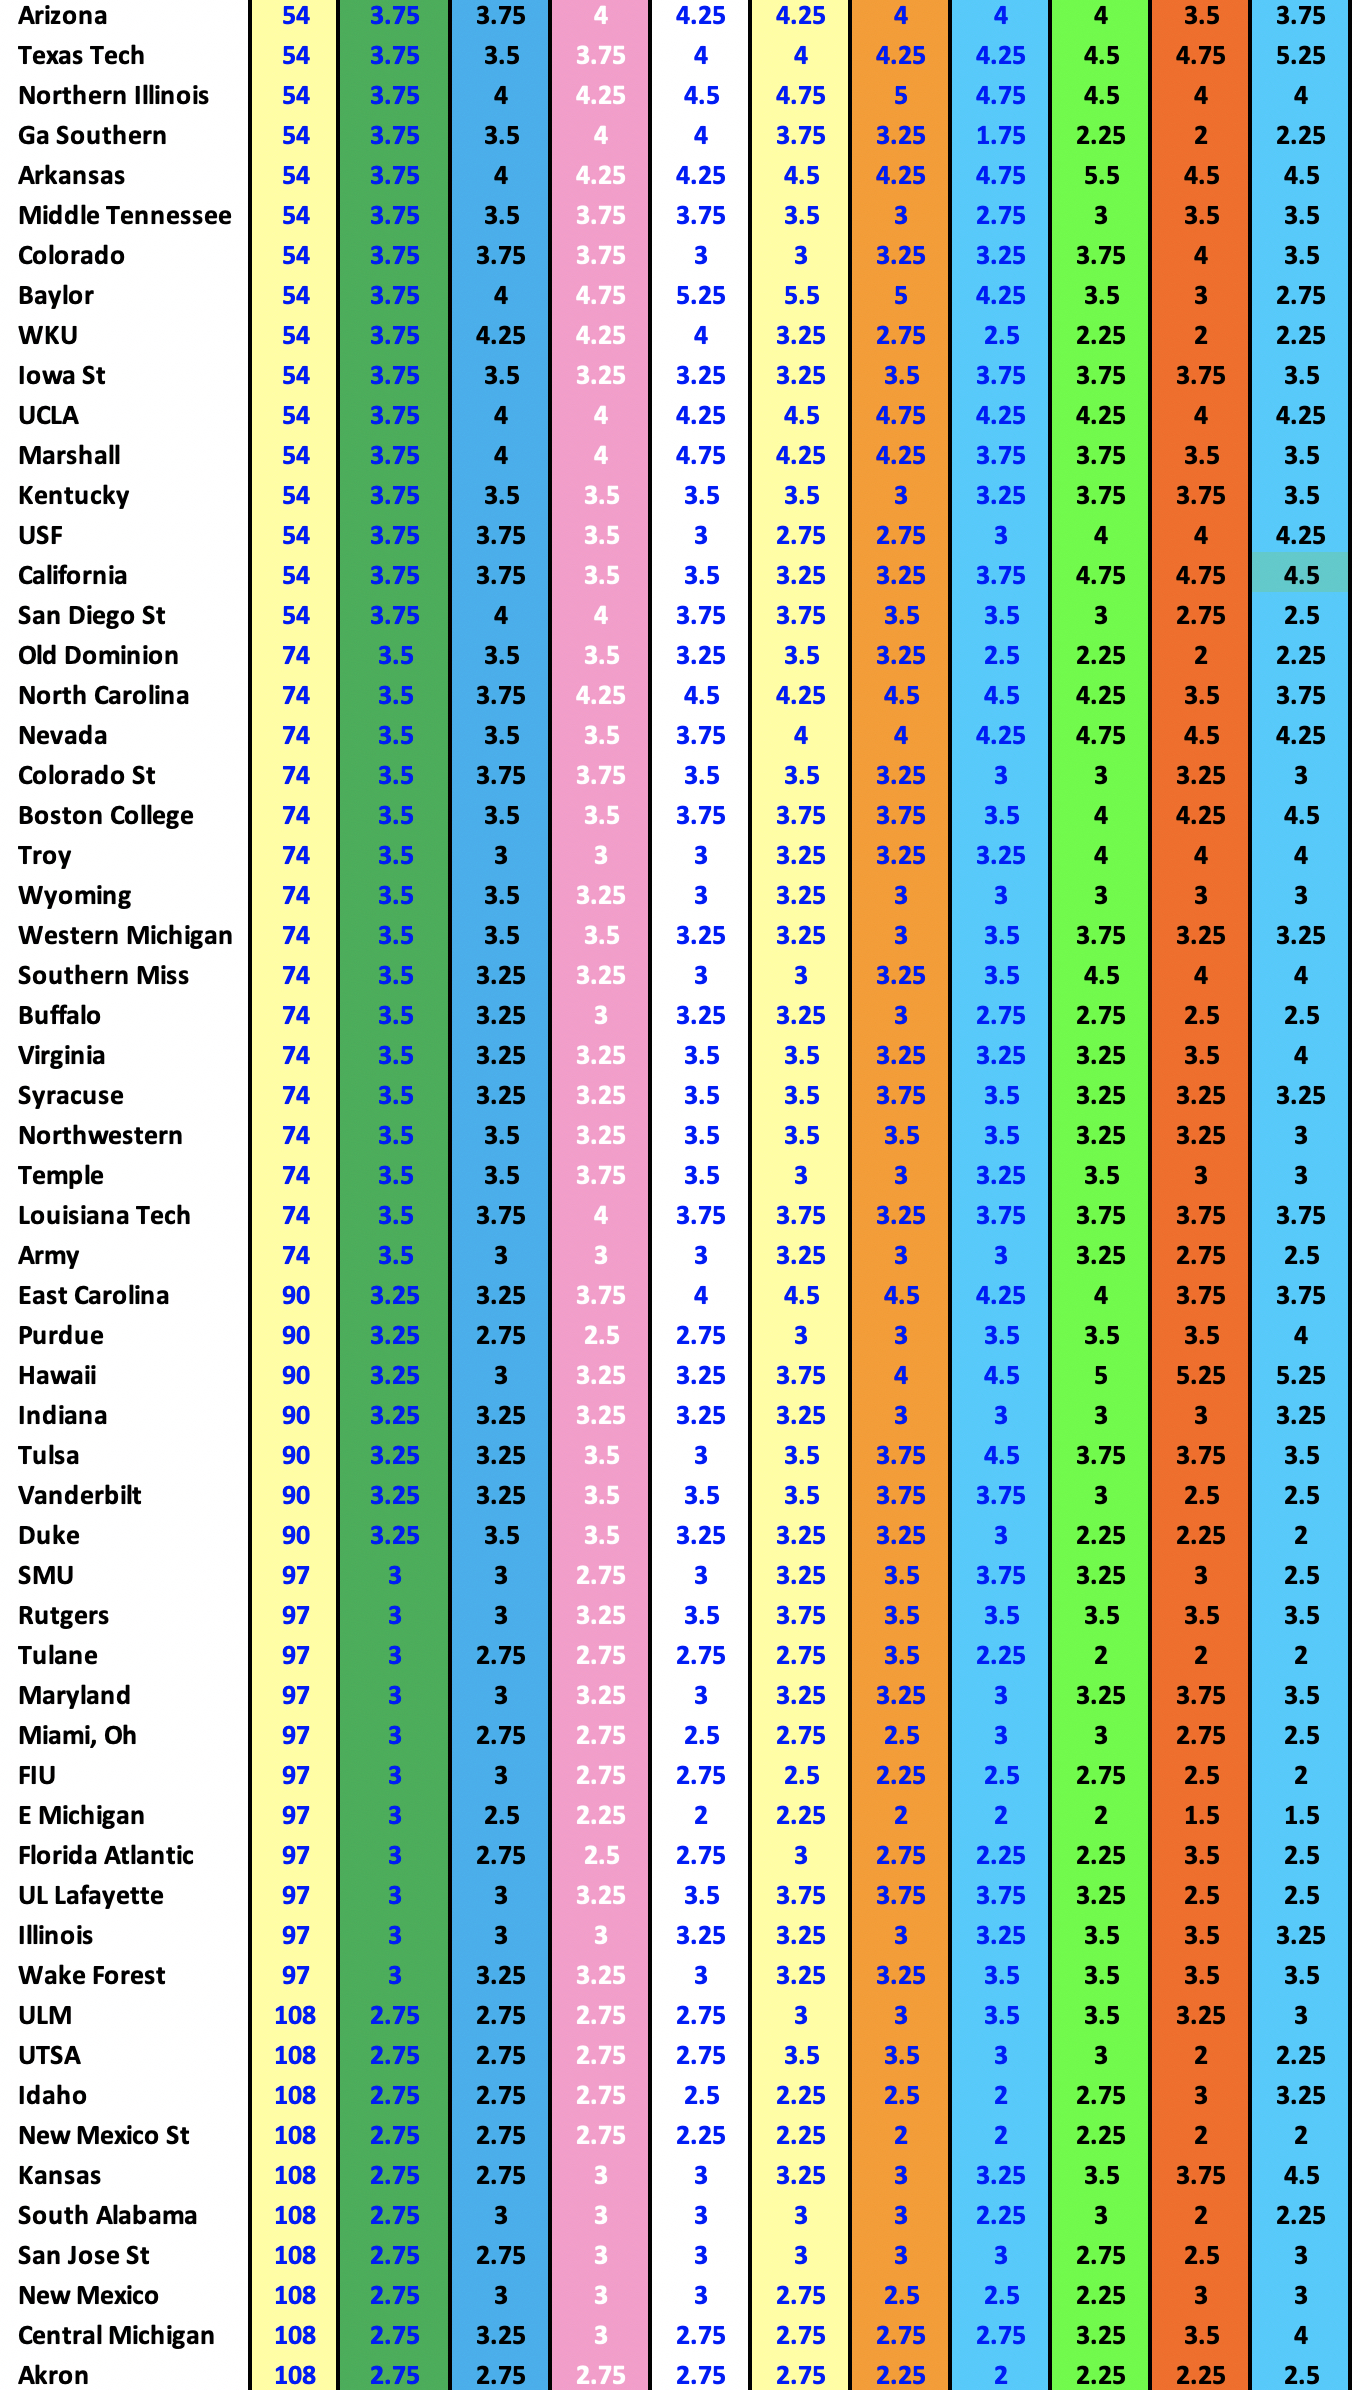
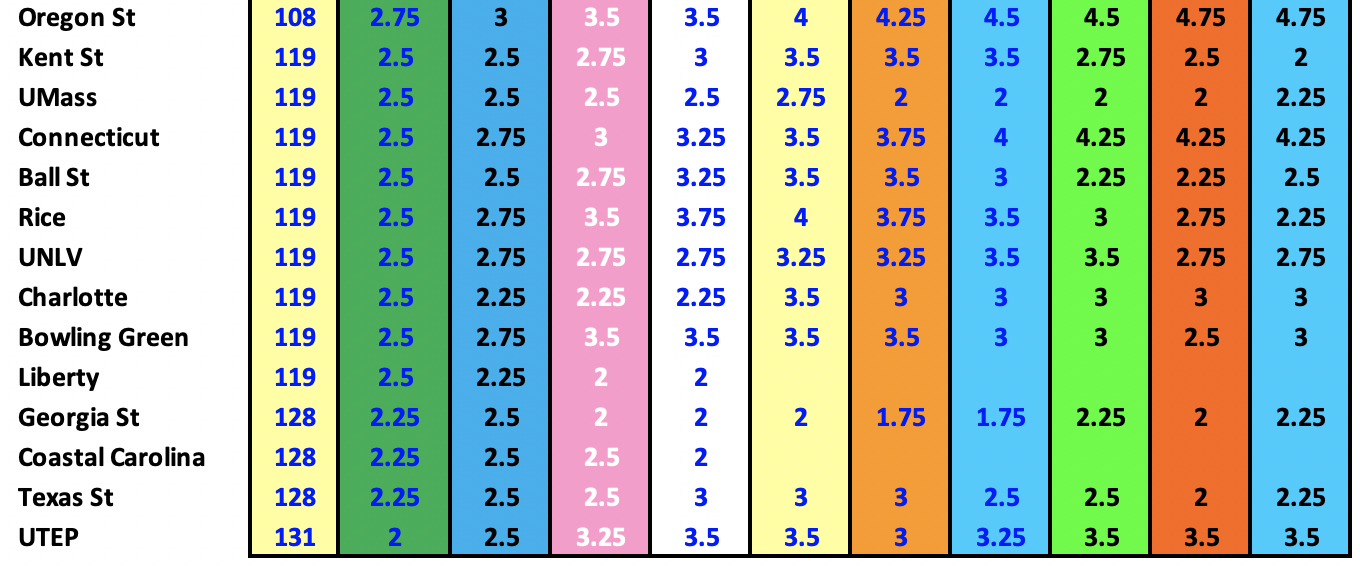
Today’s blog gives you the home field edges that will appear in my magazine, but I thought since the data is right at my fingertips that you would be interested in how I have graded each home team each year during this decade. Here is the complete list of home field edges each year in my magazine from 2010-2019. They are ranked by the upcoming ranking for the 2019 magazine in high to low order.