On every right-hand team page in the magazine, I list that teams’ current home power ratings. These home ratings go from a low of two points to a high of six points. I have nine sets of power ratings and this is the adjustment I give to the home team.
Is home field really an advantage? As I mentioned I have a large difference of the adjustment I give to the toughest home teams versus the teams’ with very little home edge. Over the past three years the 130 FBS home teams have compiled a record of 1544-909 in home game for a winning percentage of 62.9%. Over the last five years the record has remained consistent with FBS teams having a combined 2532-1537 62.2% edge. This is the 25th year of the magazine and there has never been a year in that span where home teams won under 50% of their games.
This is a five-part series and I will go thru all of the factors that I use to determine my current home power rating number for each team. Those five factors that I look at are:
- Straight Up Home Record last year, last 3 years, last 5 years.
- Average Attendance for each school and percentage crowd is of the stadium.
- My home and away Game Grades for each team for current year, 3 year and 5 year ATS Record last year, last 3 years, last 5 years average.
- ATS Record last year, last 3 years, last 5 years average.
- My personal influence. Sometimes it is not the size of the crowd but the loudness and intensity of the crowd during the game. Other factors I use my personal judgment are would be altitude and travel time.
Most of my home field edges are based on performance on the field at home. I also have to factor in what type of environment each team plays in front of. There are three different factors that I put into my computer equation. The first would be size of the stadium that a team plays in. The Big House in Michigan seats 107,601 which can be pretty intimidating for players used to playing in smaller stadiums. The smallest home field belonged to Charlotte last year with a capacity of 15.314.
The second factor and a little more important is actual attendance. Now, we have all seen games on TV or been to games where the announced attendance seems way off as they could have gone by tickets sold rather than actual people in the seats. Last year five teams played in front of an average attendance of 100,000 or more and the top 3 were all in the Big Ten with Michigan, Penn State and Ohio State. The next three on the list were all SEC teams in Alabama, LSU and Texas A&M. At the bottom of the list was Coastal Carolina with an announced average attendance of 9,203. Naturally all the teams at the bottom of the list are Group of Five Schools The lowest rated Power 5 team was Kansas from the Big 12. A poor recent record has a lot to do with it and they averaged just 19.424 this past year for their home games which ranks #93 out of 130. . Duke comes in the second lowest of the Power 5 teams at #79 with 26.546 and Wake Forest is just one spot ahead at #78 with 26,842.
The final category that I look at concerning attendance is percentage of capacity. Before I started my College Football magazine, I actually used to follow other sports than football! I would go to a Cleveland Indians game in Cleveland Stadium. I was there the night they filmed the scenes for Major League and the 80,000 seat stadium was almost full as it was a Marathon Oil giveaway night where you got free tickets with every fill up. I also went to the old Cleveland Stadium when there was an announced crowd of 8,000 but you could count by hand the roughly 1,000 people on hand in the cavernous stadium. A large full stadium is a huge plus but when a stadium is over half empty it does not generate anywhere near the home field edge.
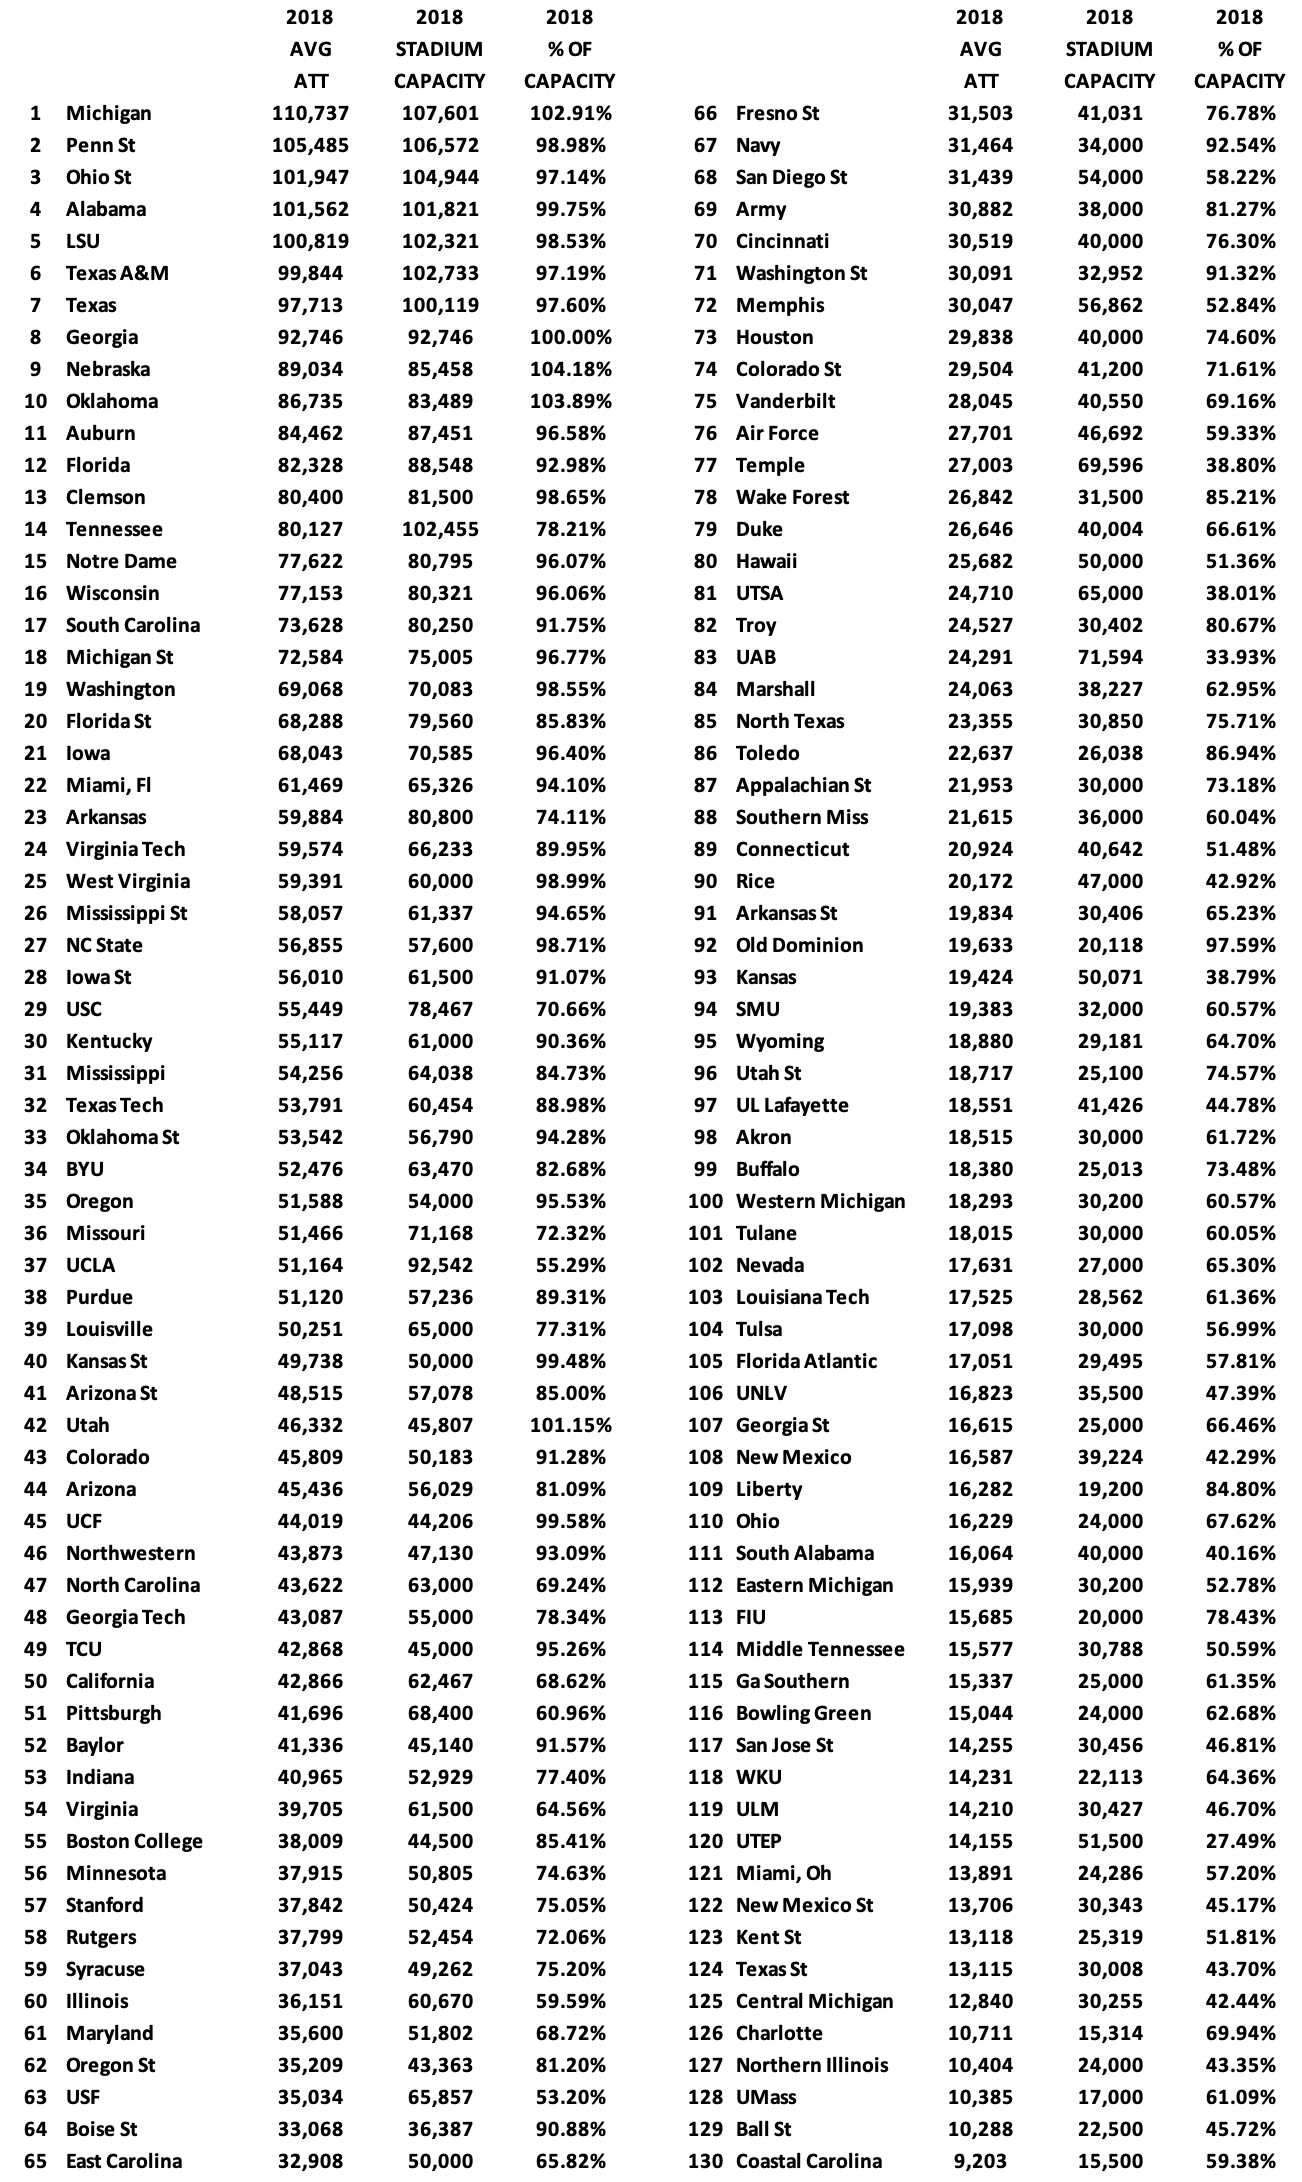
Five teams this past year played in front of crowds that exceeded capacity and they were Nebraska, Oklahoma, Michigan, Utah and Georgia. UCF averaged just 44,019 fans but in Bright House Stadium that was 99.6% of capacity which was good enough for 6th best in the capacity category. Kansas State was at 49,738 which is 99.5% and #7. UTEP had just 14,155 average attendance in their games in the Sun Bowl which is just 27.5% of capacity. UAB played in front of 24.291 and while a solid loud crowd that has helped them be unbeaten at home the last two years, OLD Legion Field seats 71,594 so that was just 34% of capacity. They are building a new stadium which will be smaller and more comfortable, and they should very shortly make a large rise in this category.
Here are the attendance numbers for each team and I have ranked them by actual attendance.