Every year I am adding to new features and articles to PhilSteele.com and for all 32 NFL teams I have added a couple extra columns to the Game-by-Game Stats that you will find for every team. A lot of people have been asking me what those columns stand for and I thought I would explain it further in today’s blog.
Sample below of LA Rams Game by Game Stats as a subscriber to Phil Steele Plus on Philsteele.com.
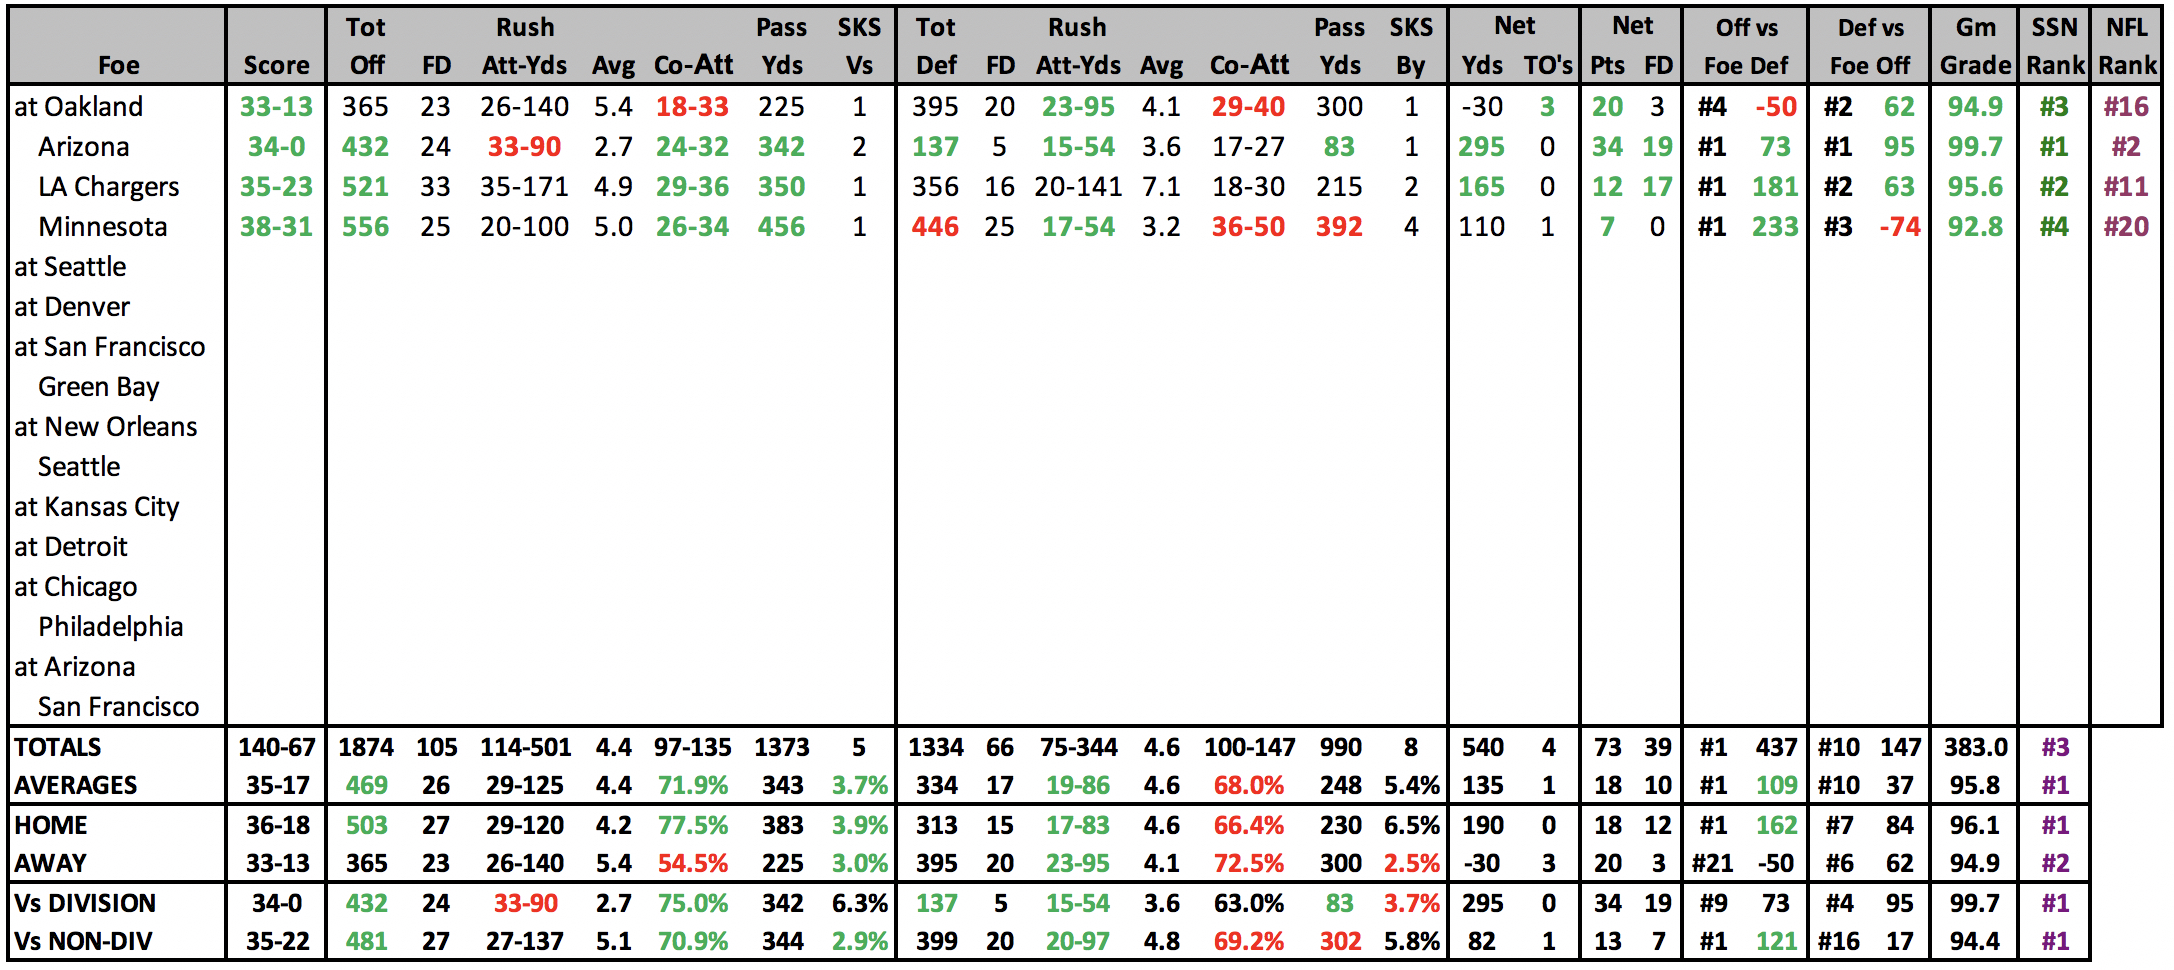
I have broke down the offensive and defensive averages and in today’s blog I took all those averages (both offense and defense) and combined them to come up with the most impressive teams in the country compared to how they fared against their opponent. Here is a ranking of all 32 NFL teams and how they did. This list does take out Garbage yards that may occur during overtime and/or blowout wins/losses. You you may see a difference in rankings from the Game by Game Stats listed on the actual NFL Teams Pages. The team page game by game stats include garbage yards.
Here is the breakdown of Offensive and Defensive YPG vs Opponents Average through week 4.
| Offensive | Defensive | |||||
| Team | Rank | Average | Rank | Average | Total | Rank |
| LA Rams | 1 | 109.3 | 10 | 36.7 | 146.0 | 1 |
| BALTIMORE | 16 | 7.4 | 1 | 95.3 | 102.8 | 2 |
| WASHINGTON | 11 | 26.6 | 3 | 76.1 | 102.6 | 3 |
| JACKSONVILLE | 19 | -4.0 | 2 | 77.6 | 73.5 | 4 |
| OAKLAND | 3 | 92.2 | 27 | -35.4 | 56.8 | 5 |
| DENVER | 12 | 26.3 | 12 | 27.9 | 54.2 | 6 |
| DETROIT | 7 | 50.2 | 18 | -2.7 | 47.5 | 7 |
| GREEN BAY | 8 | 32.5 | 15 | 9.9 | 42.3 | 8 |
| ATLANTA | 6 | 50.7 | 25 | -30.8 | 19.8 | 9 |
| MINNESOTA | 4 | 54.2 | 26 | -35.0 | 19.2 | 10 |
| NY GIANTS | 21 | -27.1 | 8 | 42.6 | 15.5 | 11 |
| NEW ENGLAND | 17 | 6.8 | 17 | 6.6 | 13.4 | 12 |
| TAMPA BAY | 2 | 96.8 | 32 | -83.8 | 12.9 | 13 |
| NEW ORLEANS | 14 | 24.8 | 21 | -12.8 | 12.1 | 14 |
| DALLAS | 26 | -45.4 | 5 | 53.7 | 8.2 | 15 |
| CHICAGO | 24 | -37.3 | 6 | 45.4 | 8.2 | 16 |
| SAN FRANCISCO | 22 | -34.9 | 9 | 41.8 | 6.9 | 17 |
| CAROLINA | 20 | -8.7 | 14 | 12.9 | 4.2 | 18 |
| LA CHARGERS | 10 | 30.0 | 24 | -26.6 | 3.4 | 19 |
| PITTSBURGH | 13 | 26.1 | 23 | -25.4 | 0.7 | 20 |
| PHILADELPHIA | 27 | -55.3 | 4 | 54.3 | -1.0 | 21 |
| HOUSTON | 5 | 53.0 | 30 | -59.4 | -6.4 | 22 |
| INDIANAPOLIS | 18 | 0.5 | 20 | -10.3 | -9.8 | 23 |
| TENNESSEE | 25 | -41.0 | 11 | 29.8 | -11.2 | 24 |
| CINCINNATI | 9 | 30.8 | 28 | -47.3 | -16.5 | 25 |
| CLEVELAND | 23 | -35.0 | 19 | -7.4 | -42.4 | 26 |
| NY JETS | 28 | -74.0 | 16 | 7.8 | -66.2 | 27 |
| KANSAS CITY | 15 | 11.8 | 31 | -83.7 | -71.9 | 28 |
| SEATTLE | 29 | -78.8 | 22 | -20.8 | -99.7 | 29 |
| ARIZONA | 31 | -135.6 | 13 | 26.9 | -108.7 | 30 |
| BUFFALO | 32 | -161.0 | 7 | 42.8 | -118.2 | 31 |
| MIAMI | 30 | -117.2 | 29 | -58.2 | -175.4 | 32 |