On every right-hand team page in the magazine, I list that teams’ current home power ratings. These home ratings go from a low of two points to a high of six points. I have nine sets of power ratings and this is the adjustment I give to the home team.
Is home field really an advantage? As I mentioned I have a large difference of the adjustment I give to the toughest home teams versus the teams’ with very little home edge. Over the past three years the 133 FBS home teams have compiled a record of 1635-919 64% in home games for a winning percentage of 64.0%. Over the last five years the record has remained consistent with FBS teams having a combined 2679-1537 63.8% edge. This is the 29th year of the magazine and there has never been a year in that span where home teams won under 50% of their games.
This is a multi-part series and I will go thru all of the factors that I use to determine my current home power rating number for each team. Those five factors that I look at are:
- Straight Up Home Record last year, last 3 years, last 5 years.
- Average Attendance for each school and percentage crowd is of the stadium.
- My home and away Game Grades for each team for current year, 3 year and 5 year ATS Record last year, last 3 years, last 5 years average.
- ATS Record last year, last 3 years, last 5 years average.
- My personal influence. Sometimes it is not the size of the crowd but the loudness and intensity of the crowd during the game. Other factors I use my personal judgment are would be altitude and travel time.
Today I am going to look at my Average Game Grades for each team when they play at home and how much that differs from their Road Average Game Grade. Let me first explain what my Average Game Grade is. When I started my magazine, I had developed a formula which matched up the rush offense of one team, versus the rush defense of their upcoming opponent and gave a projected amount of rush yards. I devised the formula for pass offense vs pass defense and points offense versus points defense. This formula than projected the results for the upcoming game. Each teams power rating is not adjusted by the total yards or total points but rather by the difference from what was expected. Let me give you an example of what I mean. If you based it just on the yards gained and adjusted your power rating, then Tennessee rushing for 250 yards versus Louisiana Tech would naturally be better than rushing for just 175 yards versus Georgia. My Power rating system however would grade the performance versus Georgia as much stronger. Georgia led the nation in rush defense allowing just 77.1 ypg and 2.88 ypc. My computer would have forecast Tennessee to rush for 106 yards vs the tough Spartan rush D. Louisiana Tech was at the other end of the spectrum with their rush D allowing 243 rush yards per game and 6.12 ypc. Those totals came against weaker rush offenses than Tennessee! My computer would have forecast Tennessee to rush for 326 rush yards. Tennessee rushing for 175 versus Georgia would have actually raised their power ratings as they exceeded expectations. Rushing for 250 yards vs Louisiana Tech’s porous rush defense would have lowered their grade!
To get an average game grade I just reversed the formula. I have the opponents’ grades for all the categories and after the game is over, we have the actual stats. I will use some basic numbers to make it simple. If team A has a rush offense of 10 and team B has a rush defense rated at 7, then team A should rush for 200 yards. Now if the game has been played, I just take the opponent rush defense of 7 reverse the chart and say that rushing for 200 yards versus a 7 level rush defense would equate to being a 10 rush offense. I then add up the power ratings of what the team actually achieved and that equates to an Average Game Grade. My average game grades also add in a home field advantage to the expectation level.
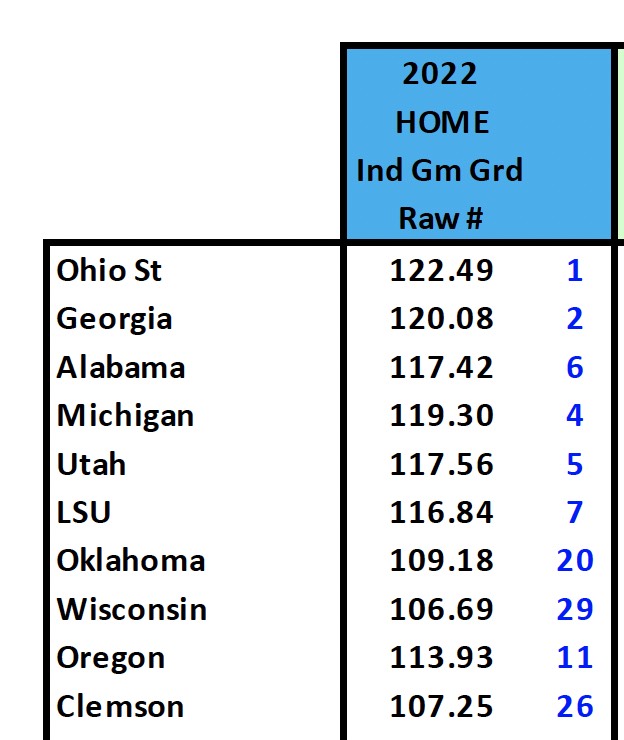
Now that you know what the average game grade is, I will start by showing you what level each team has played to at home the last 3 years. I gave 40% of the grade to 2022, 32.5% to 2021 and 27.5% of the grade to 2019’s Average Home Game Grade. I did not use 2020’s numbers as most teams had zero home crowd and with all the Covid opt outs there were many strange numbers and outcomes.
Ohio State comes up #1 at 123.02 with Georgia at #2, Alabama #3 and Michigan #4. Kansas was #111 and #117 in 2019 and 2021 but last year vaulted up to #35 in home Average Game Grade which was the biggest jump of any team. Texas A&M had been #16 and #9 in Home Average Game Grade the prior two counted years but last year slipped to #59.
At the bottom end of these rankings are teams that have indeed struggled at home in UMass, Akron, Bowling Green and Connecticut. The lowest rated Power 5 team in home games the last 3 years is Georgia tech which has played to a level of 81.24 and just above them is Vanderbilt (81.31).
Here is the complete chart the last 3 years of Average Home Game Grades.
Remember you can get 4 months of Phil Steele Plus FREE ($80 value) when you sign up for my VIP bundle. You get the magazine before it hits the bookstores, the digital magazine for FREE, 4 weeks of my Inside the Pressbox newsletter for FREE, and my FCS magazine for FREE as well. Over $200 for just $34 right now. CLICK HERE FOR DETAILS. VIP members get the magazine before anyone else, and they are mailed on the FIFO basis so the first to sign up for the offer get the magazine shipped first. We are still on DAY ONE shipments if you sign up right now. CLICK HERE TO ORDER. If you wait, you may get day TWO or day 3 and in future months the price will go up and the bonus offers will decrease so the deal is the best right now.
Much like the straight up records of teams at home, this chart favors the Blue Bloods and the best teams of football. A team like Georgia played to a 120.1 level at home which was #2 but played to a 124.23 level on the road which was the nations best. That means that their Away Average Game Grade was actually better than their Home Average Game Grade.
Wednesday’s blog will break down which teams played to the highest level at home vs how they did on the road.