
One of the main statistics that I use during the year is to look as what teams are holding their foes to either below or above their opponents season average. This is on every team page on Phil Steele Plus and in the magazine. Open up your magazine and look at the 2021 Game By Game Stats on the Right hand of any team page. You will notice columns towards the end of the line that are listed as “OFF FOE”, “VS DEF”, “DEF FOE” and “VS OFF”. For today’s blog we are going to focus on how the defenses perform. Let me dive into how I produce this number, what it means and why it is important.
Here is a picture of this year’s Georgia defense and the columns I am referring to for this article.
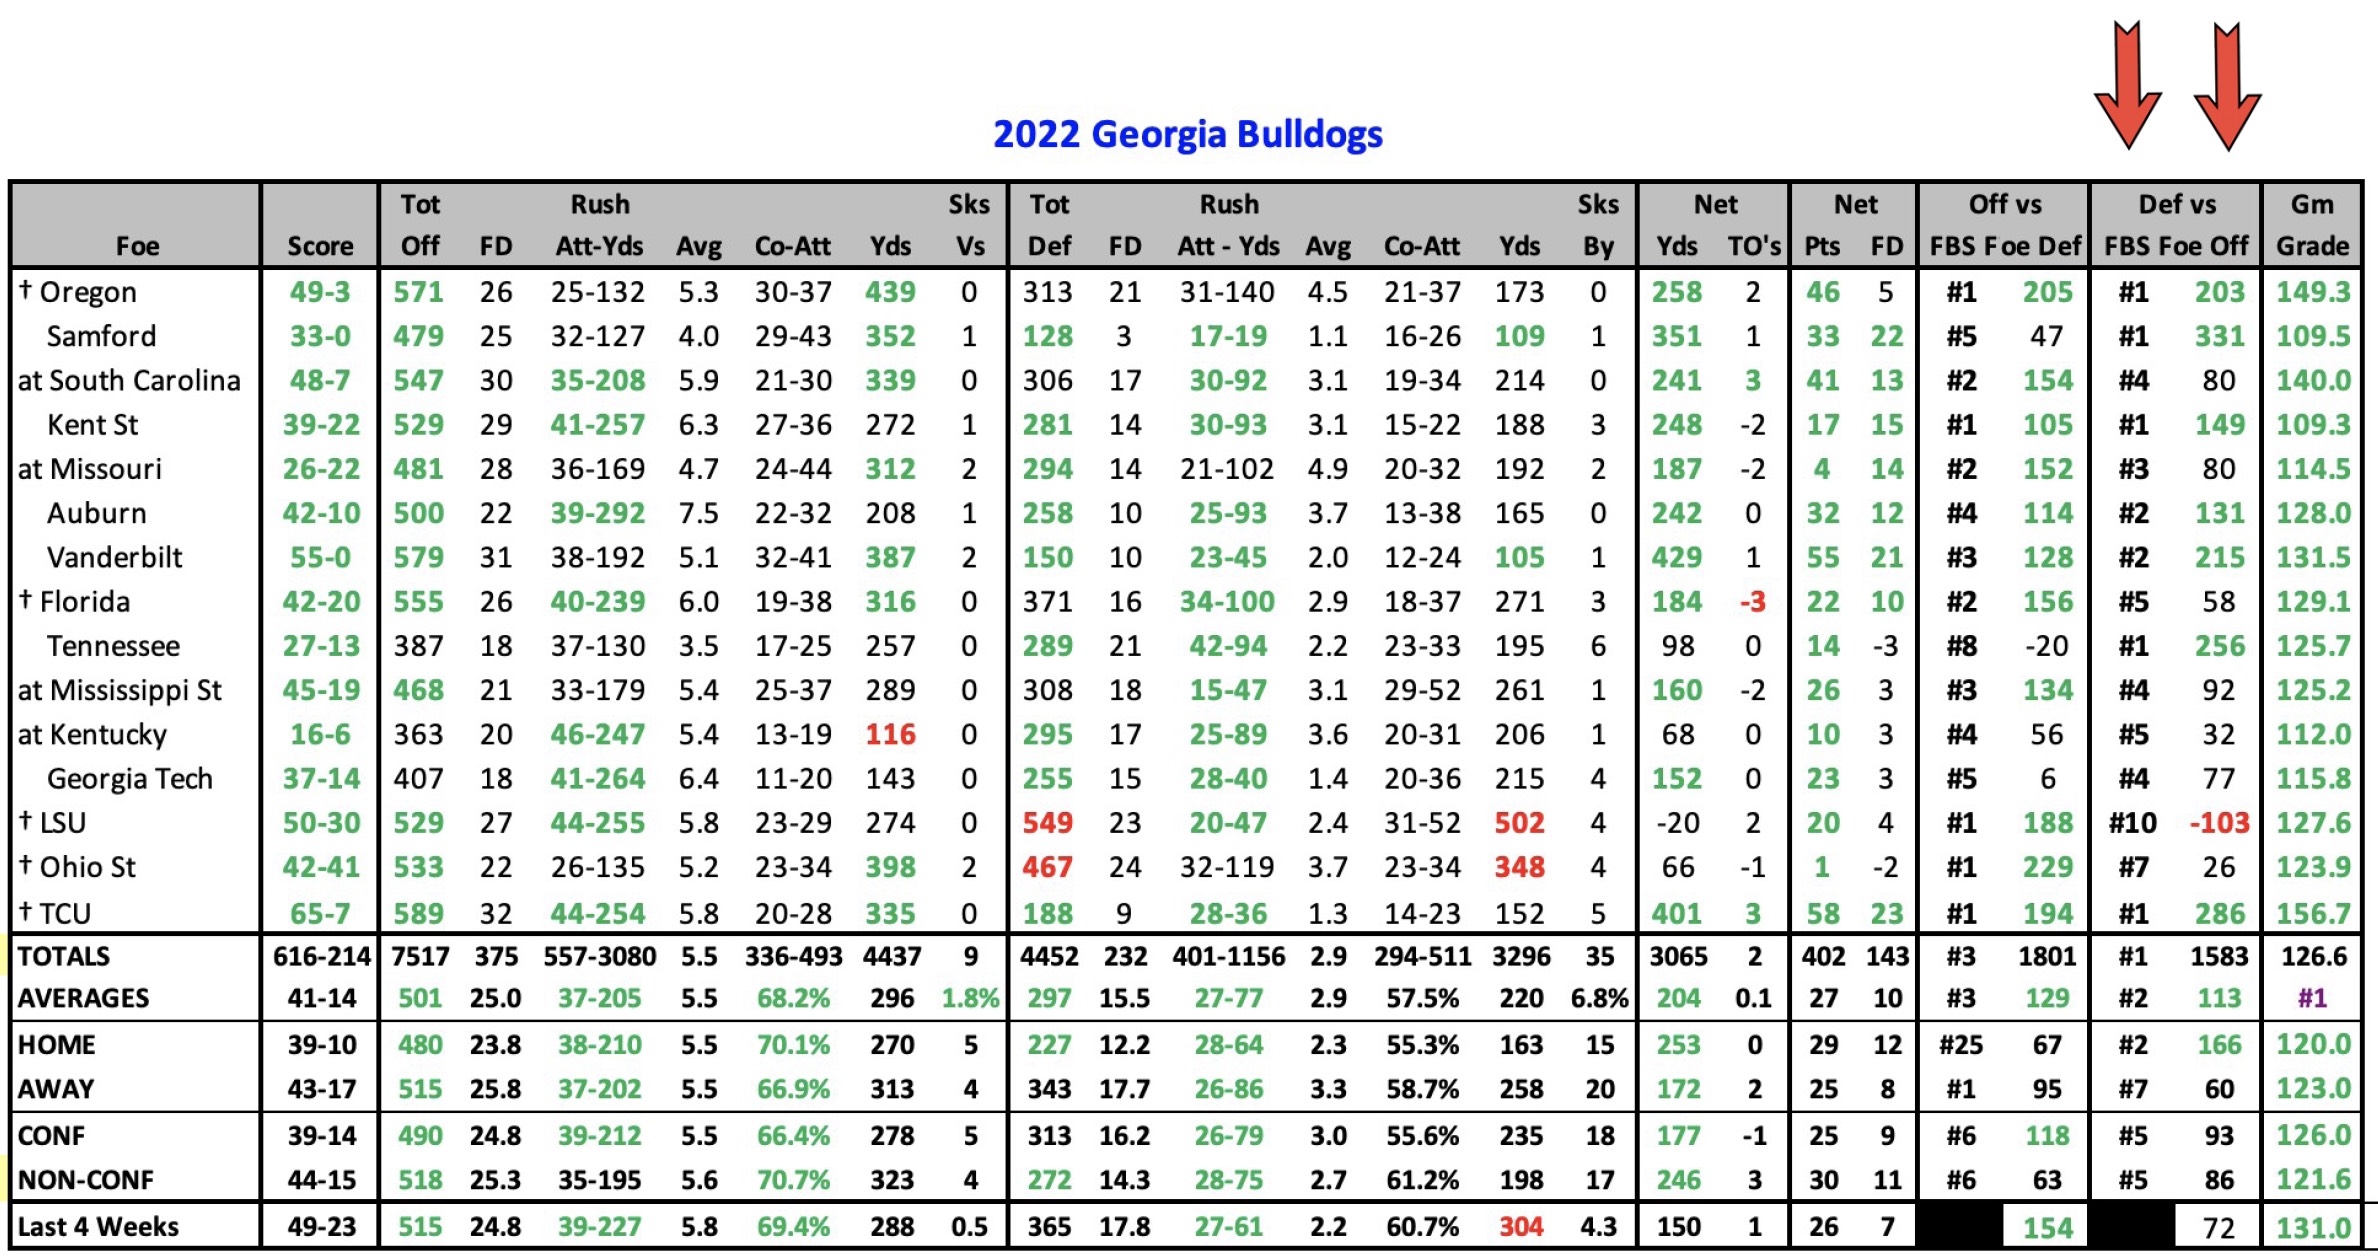
With teams running fast paced offenses and the rules shifted to favor the offense, defenses allow many more yards than they did 10 to 20 years ago. This past year the average defensive yards per game allowed in the FBS was 379.6! Now let me look at two hypothetical games for this past year. Let’s say team A held Tennessee to 380 yards and Team B held New Mexico to 380 yards. Statistically those are equal performances, right? Well my ypg vs Opponent averages view it as two entirely different efforts. Tennessee averaged 525.5 ypg on the season so Team A held Tennessee to 145.5 ypg BELOW their season average and rate a +145.5 in my ratings. New Mexico gained just 228.1 ypg on the season so Team B allowed the Lobos 151.9 ypg ABOVE their season average and rate a -151.9. Another important note as to how I come up with this number is that I do not could the individual game in the opponent average. I will give you an actual example from this past year. Georgia allowed TCU 188 yards in the title game, and I have that listed as +286 and marked in Green. If you go to TCU you will see that on the year they averaged 455 ypg so you might think my math was off. I only count TCU’s games other than Georgia and in those other 13 games TCU averaged 474 ypg and that is how I come up with the 286 and that is much more accurate as only Georgia held them to the 188.
The #X next to the defensive ranking is how the team did vs all other opponents that team faces. A couple more examples from Georgia to clarify this. Georgia has five #1’s that means they held those 5 teams to a season low on offense. Look at the Auburn and Vanderbilt games. They held Auburn to 258 total yards which is an elite performance, but it has a #2 next to it so that means one team held Auburn to even less yards and if you check the Auburn page they were held to 217 yards by Missouri. The Vanderbilt game is even more striking. Georgia held Vanderbilt to 150 total yards and that was only #2? Yes, Alabama held Vanderbilt to just 129 yards two weeks prior.
Now let’s take a look at this year’s final numbers for the 2022 season and the #1 team may surprise or even shock you! Here is the list.
The number one defense in this category was Iowa State but they were 4-8?? Iowa State allowed just 286 ypg and lost a ton of close games this year. They held five foes to season lows and held opponents to 144 ypg below their season average! They are the only one of the top 17 teams that were not bowl eligible. The #18 team might surprise you as well as Navy held foes to 70 ypg below their season average despite their losing record and the DC is now the head coach.
Tomorrow I will delve into the Offensive YPG vs the opponent averages. Remember the VIP deal for Phil Steele plus gets you the magazine BEFORE everyone else and we are mailing them out on a FIFO (First In, First Out) so the earlier you order this deal the faster yours gets shipped out and you are getting over a $200 value right now for just $34 but that prices will go up soon. Click here to order today.