A couple of years ago, I was wondering if there was any value in predicting future success/failure for teams that pulled a bunch of upsets a year prior and on the flip side of that, teams that were upset numerous times in the previous year. My hypothesis going into my research was that teams that pulled many upsets the previous year would be overvalued and see their record get weaker the following year, as teams would take them more seriously and the experts in Las Vegas would adjust their lines. Similarly, teams that were upset numerous times as favorites the previous year would be undervalued and would see their record improve.
The results coincided with my original predictions as in the last 30 years, teams that pulled 3 or more NET upsets (upset wins minus upset losses) the previous year have seen their record get weaker or stay the same 134 out of 184 times for a 72.8% success rate. On the opposite end, teams that had a -3 or more net upsets the previous year have seen their record improve or stay the same on 139 out on 211 occasions for a 65.9% success rate.
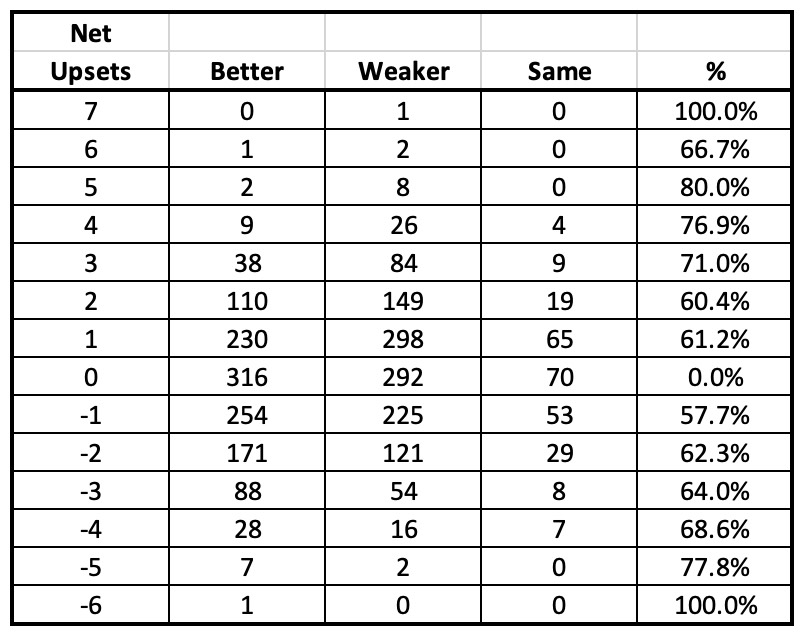
Here is a look at the overall records for teams in each Category since 1990. Note the % column is geared towards my hypothesis. The percentage for teams that pulled more upsets is the weaker and same record divided by the total. For example, there have been 9 teams that have pulled 5 Net Upsets (5 more upset wins than upset losses) the previous year in the last 20 years and of those 9 teams, 8 had a weaker record the next year for an 80% success rate for this article.
Once we get to the negative numbers those are teams that had more upset losses than upset wins and this article is saying that those teams will improve their record. There have been 9 teams since 2000 that had -5 Upsets the previous year and 7 of those teams improved their record and two had a weaker record for a 77.8% success rate for this article.
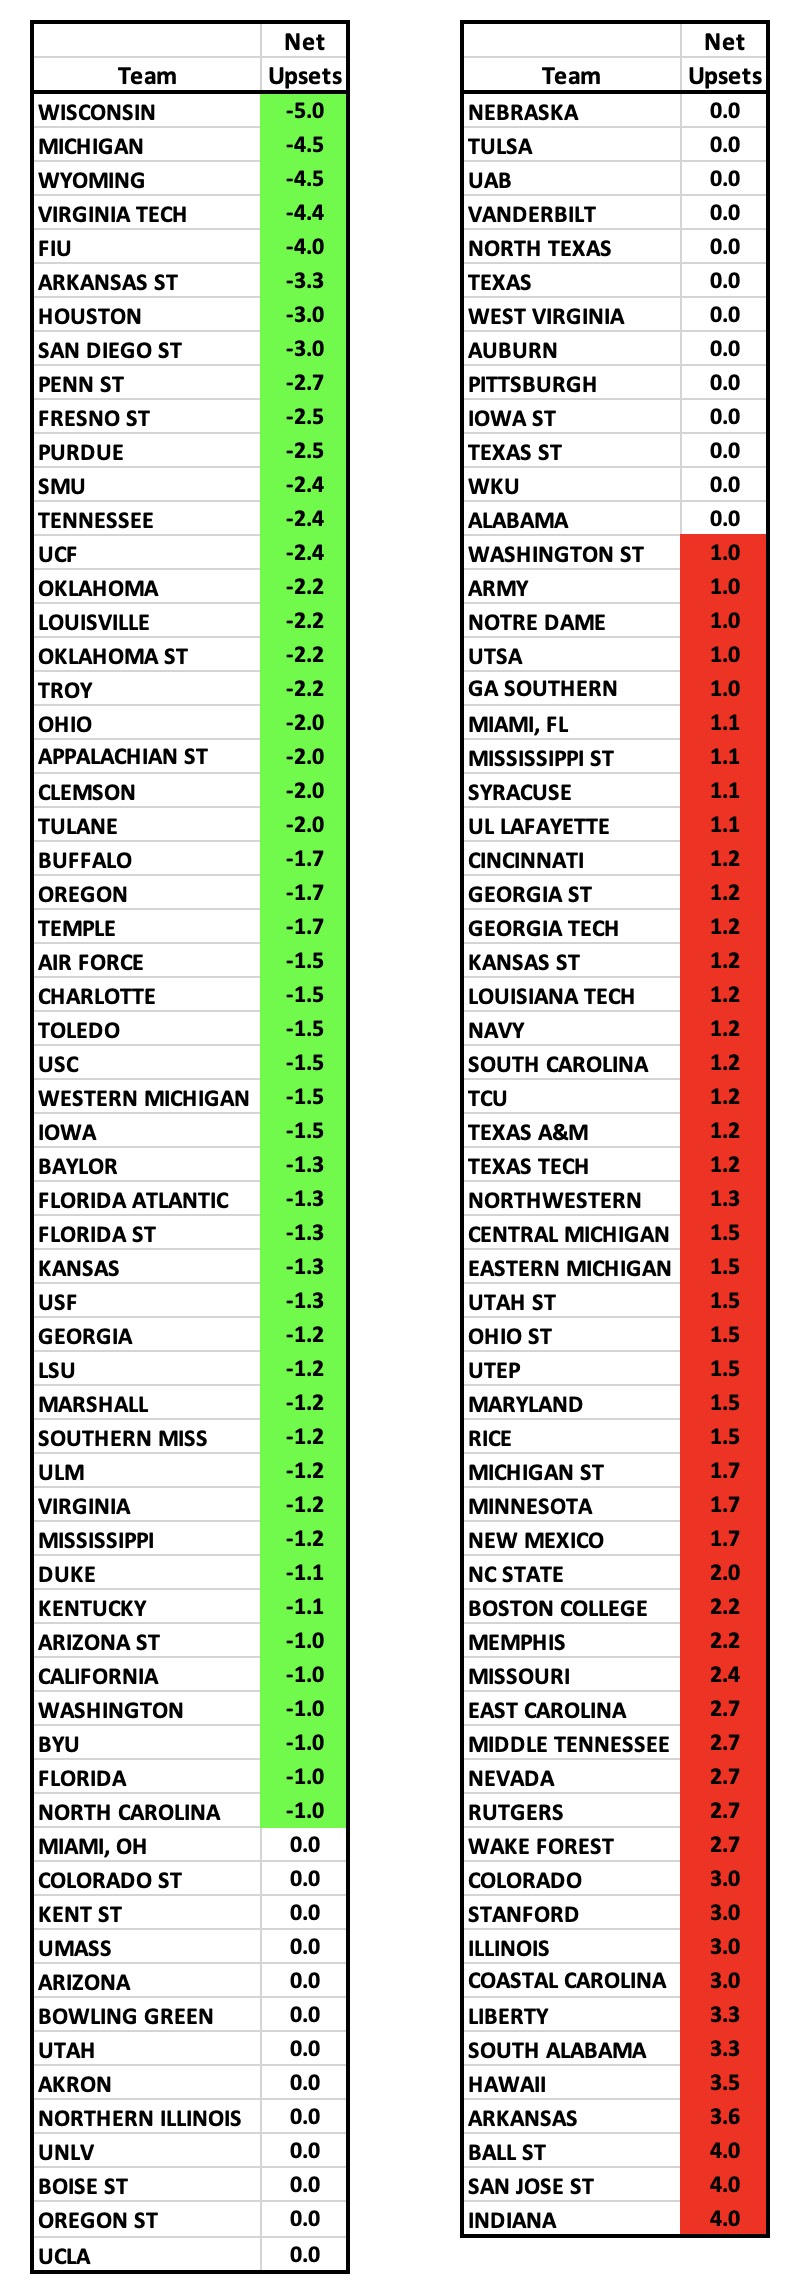
Now here is a look at this what the teams did last year. Those that pulled the most upsets are listed as + Upsets and likely headed for a weaker season. Those that were upset the most last year are likely headed for stronger seasons. Those are the teams that I have listed at the top and the negative numbers means their upset losses outnumbered their upset wins by that total. Last year at the top of the chart of teams that pulled the most net upsets in 2019 were Oregon St, Baylor and Kansas St. Oregon St fell from 5-7 to 2-5, Baylor plummeted from 11-3 to 2-7 and Kansas State went from 8-5 to 4-6. Last year two teams were off 4 net upset losses in 2019 in Miami Florida and Missouri. Miami went from 6-7 to 8-3 and at one point were 8-1 and #9 in the country. Missouri did not play any non-conference games and when the schedule was adjusted they drew Alabama and LSU from the West and were only favored in 3 games in 2020 but did better than expected getting to 5-5 so even though they matched the 6-6 of 2019, it was indeed a better season playing 10 SEC games but on this chart it is counted as the same record.