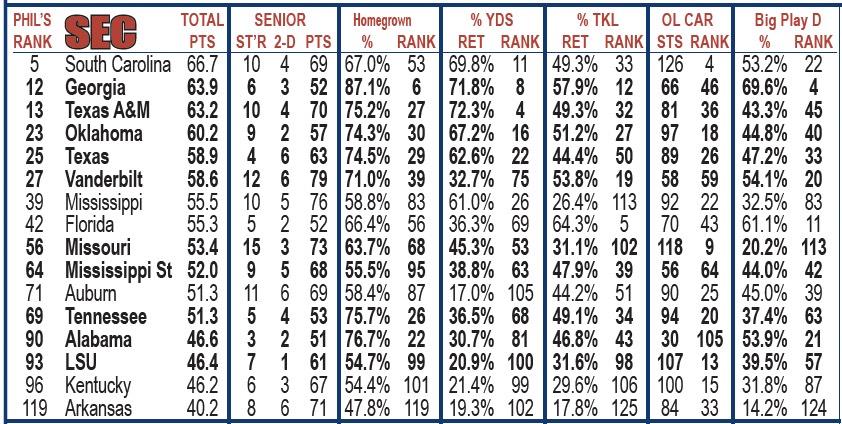
I have had the Experience Chart in the magazine since 2002. That 2002 was Volume 8 of the magazine and the 2nd year since moving from black and white on newsprint up to color print and glossy pages. That first Experience chart had 8 categories. They were Senior Starters then Seniors in the two deep, Junior Starters, Juniors in the two deep, Sophomore starters, Sophomores in the two deep and Freshmen starters and Freshmen in the two deep.
Thru the years I have continued to improve the Experience Chart by adding in many more factors. The Experience Chart was the same from 2002-2008. In 2009 I kept the Senior starters and Seniors in the Two deep category but added percentage of lettermen returning, percentage of yards returning and percentage of tackles returning. I also added O-Line Career starts. A few years back I added percentage of big plays (Sacks, TFL’s, Int’s, pbu’s) on defense returning.
One thing I have not done is gone back and researched how the chart had done as being a predictor for the upcoming season. On page three of this last year’s magazine, you will notice the All-Meathead team which is produced by Jacob Hester and Bobby Carpenter. Every time I have been on Off Campus Jacob has brought up the Experience Chart and many times, he has asked me how the Experience Chart has done, and I never had the answer. While I have added to the Experience Chart, I have never taken the time to analyze how the chart has done as a predictor. The last two years’ I have, and I was VERY pleased with the results!
I looked at the Experience Charts from 2025, 2024, 2023, 2022, 2019, 2018, 2017, 2016, 2015, 2014, 2013, 2012 and 2011. I did not bother to look at 2020 as that was a strange year with some teams sitting out the year or playing just 6 games while some teams played a full schedule. Games were postponed, rescheduled, cancelled, etc. Some teams would be missing a third of their roster for some games. Not much can be culled from that type of year. I did not include 2020.
Here is what my 14 years of researching the Experience Chart has uncovered. There were 210 teams ranked in the Top 15 of the Experience Chart and 117 of them improved their record with 27 having the same record and only 66 of the teams 31% had a weaker record the next year for a 69% success rate. Last year Vanderbilt was the poster child of this group as they were #1 on the Experience Chart and went from 4-8 to 10-2 in the regular season a 6 games increase! Teams ranked in the #16-30 slot had a 64.8% success rate with only 74 of the 210 having a weaker record. Teams in the #31-45 group were almost the same with a 62.9% success rate with 78 of the 210 teams having a weaker record. Overall is a team ranked in the top 60 of the Experience Chart 436 improved their record, 101 remained the same and 303 got weaker for a 63.9% success rate.
The other end of the chart had even better success. Of the teams at the bottom 15 of the experience Chart 83.2% of the teams had a weaker or the same record as the previous year with just 20 teams managing to improve their record. Last year Marshall was #134 on the Experience Chart and went from 10-3 and Sun Belt Champs to just 5-7. Of the teams from #102-#116 only 61 of the 180 teams managed to improve their record for a 66.3% % success rate of teams near the bottom having a weaker or the same record the next year. The next level of teams from #87-#101 had an even better 68.9% success rate with just 56 of the 180 teams improving their record. As you would expect teams in the next level (middle of the pack) were about a 50/50 proposition. I was very pleased with the results.
Let me give you a few examples of teams that ranked in the Top 15 of the Experience Chart. In 2022 Tulane, TCU, Troy, and Tennessee ALL ranked in the Top 15 of the Experience Chart. TCU was picked 8th in the Big 12 but played in the National Title game! Tulane went from 2-10 to 12-2 and beat USC in the Cotton Bowl finishing a remarkable #9 AP. Tennessee went from 7-6 to 8-0 and was actually #1 in the first Playoff rankings and finished 11-2 and #6. Troy was off 3 straight losing seasons and went 12-2 and was #19! Last year Florida St was #2 on the Experience Chart and went undefeated in the regular season and won the ACC title. Michigan was #7 on the Experience Chart and went undefeated and won the national title! Missouri was #8 on the Experience Chart and was picked sixth in the SEC East but went 11-2 and beat Ohio State in the bowl and finished #8 AP.
Last year Vanderbilt was #1 and had the best season in school history winning 10 games. Texas Tech was #5 and won the Big 12. Texas A&M was #6 and made the playoffs. Virginia was #8 and was picked 14th in the ACC but was in the ACC title game. Miss St, Northwestern and Arizona all went from losing seasons to bowls and all were in the top 15.
It was not just the last two years. Let me give you some of the other Top 15 teams and how they fared. In 2018 Oregon was unranked, they were #1 on my Exp Chart in 2019 and went 12-2 and finished #5 in the country. UAB was not even playing football in 2016 but in just their 2nd year back was #7 on the Experience Chart and went 11-3 in 2018. TCU was 6-7 in 2016 but was #3 on my Exp Chart and got to the Big 12 title game and finished 11-3 and #9 AP. Georgia was 8-5 in 2016 but was #8 on my Exp Chart in 2017 and won the SEC and made it to the National Title game before losing to Alabama.
Now let me look at some of the teams from the bottom of the Experience Chart. In 2022 Texas A&M was #124 on my Exp Chart and came into the season ranked in the Top 10. They finished just 5-7 and missed out on a bowl. Nevada was 8-5 in 2021 but was dead last in my Exp Chart last year and fell to 2-10. In 2018 Fresno St was 12-2 but was just #129 on my Exp Chart in 2019 and fell to 4-8. Stanford won an average of 10 games per year from 2015-’18 but was #118 on my Exp Chart in 2019 and went 4-8. Central Michigan was 8-5 in 2017 but was #124 on my Exp chart in 2018 and went just 1-11. Notre Dame was 10-3 in 2015 but was just #121 on my Exp Chart in 2016 and fell all the way to a rare losing season at 4-8. In ‘23 some of the teams near the bottom were East Carolina which went from 8-5 to 2-10, Cincinnati which went from 9-4 to 3-9 and UAB which went from 7-6 to 3-9. Last year’s standouts from the bottom 15 were Northern Illinois which went from 8-5 to 3-9, Marshall which went from Sun Belt champs and 10-3 to just 5-7 and Sam Houston St which went from 10-3 to just 2-10.
This blog has me fired up to dig into the Experience Chart even more. Last year I did the research on the biggest changes each year of the Experience Chart. As an example, in ‘23 Missouri went from being #100 on my Exp Chart all the way up to 8, a jump of 92 points!. Also TCU fell from #3 to #110 on my Exp Chart and they went from 13-2 to 5-7.
I will have a blog every day this summer and check out my twitter @philsteele042 to find out if I am on a radio show in your area this week. If you want this years’ Experience Chart, I have it on page 25 in this years magazine and list each teams Experience Rank on the right hand page. If you do not already have a magazine, here is the best way to get one.
This years magazine is 376 pages and the biggest and best ever. Here are the different ways you can order the magazine.
Option #1 – Pick one up at your local Barnes and Noble or Books-a-Million store. When you go into a Barnes and Noble you get two different cover choices in each store! The official on sale date is July 4th but it is hitting some stores sooner. It is also available at Books-a-Million which all have the national cover. These two distributors are our exclusive vendors of the magazine, and they are not available at Walmart’s, Walgreens, Grocery Stores, other bookstores or drug stores so save your gas. The only two brick and mortar store they are available are Barnes and Noble and Books-A-Million.
Option #2 – Buy the Hard copy of the magazine at philsteele.com or call 1-866-918-7711. The total cost depends on where you live and which of the four types of shipping you choose. It will cost you in the ballpark of $10 for shipping and tax. The biggest advantage of buying online is that When you buy the Hard copy you GET the DIGITAL version of the magazine ($19.99) for FREE and it is updated thru September. Your digital access begins immediately when you purchase. You also get your choice of covers (National, SEC, Midwest, Southwest, West or East Coast) as these are generally mailed out the same or next business day as the order. Order Here!
Option #3 – Buy the digital magazine. The best thing about the digital magazine is that it is updated all the way thru the month of September. If a coach gets fired (that has happened the last couple of years) we update it. If a player is injured and out for the year we CIRCLE him in the magazine. If a player is added late (very rare) we put him in. Any changes to the team from the start of June thru the month of September is updated in the digital version. When you go to the philsteele.com store you will not see a picture there, you need to click on Digital Editions and order it there. It will be activated immediately giving you instant access. Order the Digital Here!
Option #4 – Order the VIP Bundle – The price of the VIP bundle is $44.95. With the VIP bundle you get the National Cover of the magazine. All VIP’s received EXCLUSIVE ACCESS to the digital version of the magazine for one week, but that bonus is gone as the digital is now available for everyone. You receive two magazines PLUS the Digital Magazine. You also receive FOUR Free issues of my Inside the Pressbox Newsletter ($20 per issue – $80 value) which gives you my Forecast and my computers forecast on EVERY FBS game each week. You also receive access to Phil Steele Plus ($25 per month) for the months of June, July, August and September! The VIP Bundle also includes SHIPPING so it is basically just $10 more than ordering the magazine by itself! Order the Reg VIP Bundle Here!!
Option #5 – THE BEST BUY – Order the Super VIP Bundle – The price of the SUPER VIP bundle is $74.95. With the Super VIP Bundle you receive
TWO magazines INCLUDING SHIPPING ($69 value!), EXCLUSIVE ACCESS to the digital version for one week (that happened already), order shipped next business day. Use the 2nd magazine when your first one gets dogeared or sell/give it to a friend.
Digital magazine ($19.95 value) FREE – The digital magazine is updated thru September (see option 3) and you get immediate access to the digital version upon purchase.
Four Issues of my Inside the Pressbox newsletter ($80 value) which gives you my forecast and my COMPUTERs forecast on EVERY FBS games each week (including FBS vs FCS) the same bonuses that the VIP’s get. You also receive…
FCS Digital Magazine ($25) FREE – Two full pages on Every FCS team laid out the same way the pages are for the FBS magazine. There are 128 FCS teams so over 250 pages!
NFL Digital Magazine ($15) FREE – Four full pages on Every NFL team and a Fantasy Football section!
Phil Steele Plus ($99 value) ENTIRE SEASON FREE – This is a tremendous addition. If you purchase the full year access to Phil Steele Plus it is $99 but you get it included in the Super VIP Bundle Purchase the Super VIP Bundle now and get the entire year of Phil Steele Plus FREE!! Here is a link to all the great info available on Phil Steele Plus including the schedule predictor! Order the Super VIP Bundle Here!!
