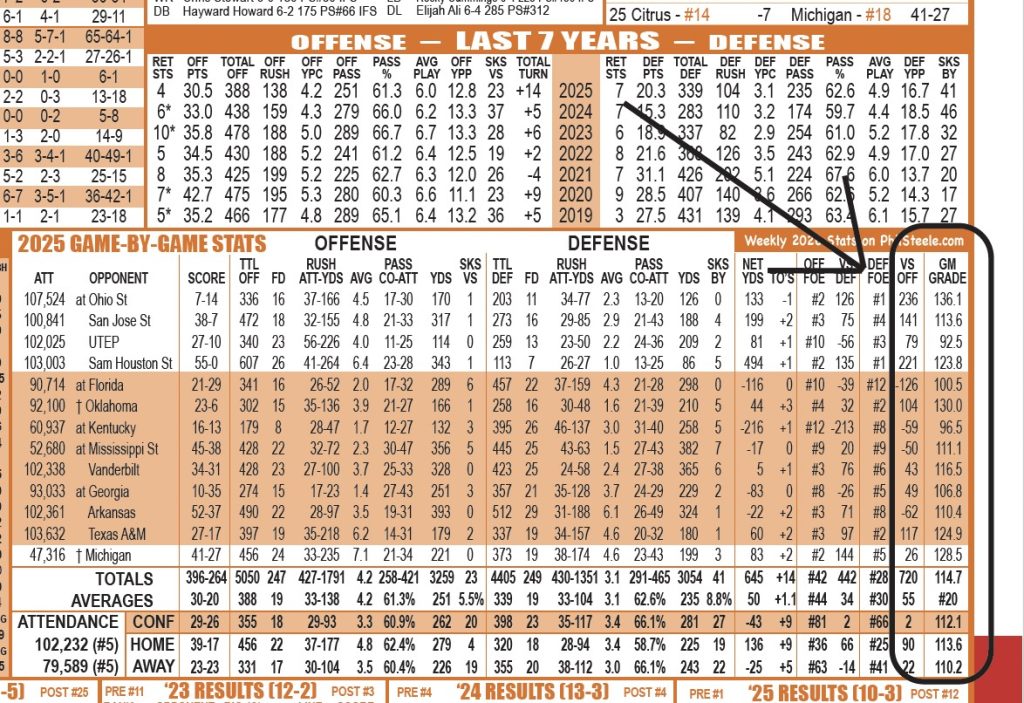
If you look at my magazine at the end of every stat line for last year’s game in my Average Game Grade. Here is a sample from this year’s magazine using Texas and showing you where the Average Game Grade (AGG) is located.
Let me now go into why I feel the average game grade is a superior power rating.
NO TEAM BIAS! – How many times have you heard after the first month of the season that a team that was rated #3 at the start of the year but has looked average in their games is ranked ahead of a team that was #21 at the start of the year and dominated two ranked foes or some version of that. The great thing about my Average Game Grade is there is no starting point for any team. Last year Texas beat Kentucky 16-13 on the road but were actually outgained 395-179 and out FD 26-8. That game earned them a 96.5 AGG. Texas beat UTEP 27-10 with only a 340-259-yard edge. Texas earned a 96.5 AGG grade. That was their two lowest AGG’s of the year by FAR. I just mentioned that the AGG has no starting point for Texas. Let’s say a team like Akron went into Kentucky and upset the Wildcats despite being outgained 395-179 and got past UTEP 27-10 with a 340-359 yard edge the exact same stats. Akron’s AGG for those games would be exactly the same at 95.5 and 92.5. The AGG only takes in the stats for the game, the strength of the opponent and the site. There is no team bias involved at all!
It accounts for more than the score in a game – I started my business at the age of 21 and after some successful years as a handicapper I put up the first Phil Steele College Football Preview in 1995, 32 years ago. I have a set up where I have 12 TV’s in front of me on a Saturday and I watch twelve 12:00 noon games, twelve 3:30 games, twelve 7:00 games and then some late night games. Let’s say I watch 36 games every Saturday. During the week I watch taped games of the ones I missed. For simplicity sake let’s just use 40 games a week and there are 13 weeks in a year plus the 40 bowl games would be 560 games a year. In just the time I have put out the magazine that would be 17,920 games. That does not include the weekday games I watch or the years before my magazine or the years before starting the magazine. In that time, I have watched many types of games. Games played in good weather, bad weather, cold weather, hot weather, underdog upsets, favorites dominate, etc. I can tell you I have watched close to 1,000 games where the better team on that day did not win. This would involve when a team dominated a game at the line of scrimmage and statistically but because of some fluke plays actually lost on the scoreboard. That may happen less than 10% of the time but does occur often. My AGG takes into account the score of a game but also the stats. Let’s go back to the Texas/Kentucky game I referenced. Kentucky was 2-2 and a 3 TD underdog at home. That is why Texas despite the win only earned a 95.5 grade for being outgained by a team that would finish 5-7, 395-179. Kentucky on the other hand took a ranked team to OT and had an amazing 26-8 FD edge vs a Texas team that finished #12 AP and 10-3. Kentucky actually earned an AGG of 123.3 for the game despite losing in OT on the scoreboard as they were stopped on downs at the 1-yard line in OT after having a 1st and goal and the 3. Any Texas fan will tell you they felt fortunate to win the game and I felt the same way watching it and the AGG clearly said Kentucky took on the tougher foe and played better. That is another great thing about the AGG it looks at how the game was played and the strength of opponent and not just the final score.
The AGG takes into account the strength of the opponent and site – We will stay on Texas as that is the team I have pictured at the top. Texas blew out Sam Houston St 55-0 at home and they lost on the road to Ohio State 14-7. Clearly the Blowout over Sam Houston was better than a loss right? Well, not to the AGG. Texas went on the road vs an Ohio St team that would finish the regular season 12-0 and #1 in the country. Ohio St won its regular season games by an average margin of 37-8 and outgained their foes by an average of 438-203! They were dominant. Texas went on the road and had a 336-203-yard edge vs Ohio St with two 4th down stops in the red zone and Ohio St scored a TD on a 4th down and that was the difference in the game as Texas lost 14-7. Sam Houston St was 2-10 last year and lost their games by an average of 38-18 and 39-15 on the road. Sam Houston was -199 ypg on the road and faced just one P4 school all year! Of course, Texas should have blown them out. Texas only earned a 123.8 AGG for their blowout home win but a 136.1 AGG for their road loss to powerful Ohio St.
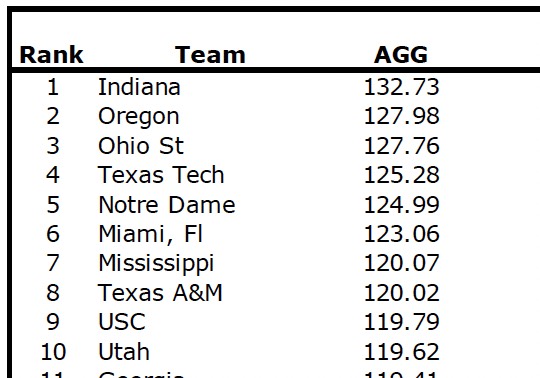
Here are the final AGG rankings for 2025. You will notice that the teams that made the final four last year which were Indiana, Oregon, Miami Fla and Ole Miss all ranked in the top 8 of the AGG and the team that they left out of the playoff in Notre Dame was actually #5. Tulane which was blown out by Ole Miss in the playoffs was only #57 at 104.57.
The AGG DURING the season is a power rating that is updated on Phil Steele Plus EVERY Sunday morning! You can get the year-to-date AGG, the conference AGG (just involving conference games) and after 5 weeks the last 4 weeks AGG grades every Sunday! So you do not have to do the math, in the Schedule Predictor I update the numbers on Monday and give you who should be favored and by how much as part of the many columns of forecasts available on the schedule predictor. If the AGG differs from the Vegas Line by 7 points it becomes a Best Bet on the schedule predictor and those plays are now 182-126 over 3 years!
Last 4 weeks AGG – I love this power rating as it throws out the start of the year and just focuses on how a team is performing the last 4 weeks. Once again it has no starting point so it only factors in strength of opponent, site, final score, offensive rush and pass and defensive rush and pass vs opponents strengths and weaknesses. I update this number in the schedule predictor every Monday. The last 3 years the Last 4 weeks AGG plays have gone 178-120! Those are just the best bets and the games that were close to Best Bets are hitting 62%!!
Conference AGG – These numbers only reflect how teams do in conference play. Some teams put little effort into non-conference games saving the good stuff to try and win the league. Some teams put a lot into non-conference games knowing that wins in conference play will be tough. This eliminates all non-conference games where a team maybe gave a C effort and just counts how each team does in conference play. There will be one week where the ratings are identical to the last 4 weeks if a team plays 4 straight conference games to open the league schedule but it will differ all other weeks. The last two years these Best Bets have gone a combined 66-41!
Home/Away AGG – Last year UTSA played at a 107.4 AGG at home but just a 96.7 AGG the road. They are 33-6 SU at home under Jeff Traylor in the Alamodome and just 17-17 SU on the road. UCLA does not have a great home edge in the cavernous Rose Bowl as their average attendance last year was 40.9% of Capacity (#128). It is no wonder UCLA played to a 96.9 AGG at home but were at a 107.9 AGG on the road. This is yet another way to find an edge. I did not have a column for this in the schedule predictor last year but may add it this year. Last year on the Phil Steele Plus Tour With Selections I twice used a Home/Away AGG game of the week and they both won with Georgia Southern over Georgia St and Clemson over South Carolina.
Phil Steele Plus is a tremendous handicapping tool for you to use during the year. You get access to…..
138 FBS teams updated Sunday Morning with GREEN (good #) and RED (bad #) highlighted
132 FCS team pages updated by Wednesday and includes AGG in all categories
ACCESS to the Schedule Predictor with its plethora of Best Bets
Team pages include
Individual Stats updated weekly including Game by Game Stats, Start Chart, Last 45+ years results, Last 38 years coaching history, Schedule with half time stats, box scores for every game, Draft history, updated team stats including AGG in all categories
Updated Plus minus ratings weekly
YPG vs Opp Avg
Pass Efficiency Defense updated weekly
Special teams Ranking updated weekly
Phil Steele College Football Preview (digital version)
Phil Steele FCS College Digital Magazine (two full pages on every FCS team!)
And. More. Phil Steele Plus contains all the information I use when handicapping a game. It is just $99 for the year and that comes out to $4.50 a week for the 22 weeks of football. If you have purchased a magazine, I will give you half off and you can get it for just $49 for the year. If you purchased the magazine thru our office or on the website, we can look it up and give you a special one use coupon code to get it for just $49. If you bought the magazine at Barnes and Noble then have the magazine with you and call 1-866-918-7711 and we will have you flip to a page and verify you have the magazine and then give you a one time use coupon code and you can get Phil Steele Plus for just $49. Call today and get All of August, September, October, November, December, January and February (32 weeks) for just $1.53 per week! 1-866-918-7711. Phil Steele Plus also gets you access to the Digital version of my magazine and my digital FCS magazine and those two alone are a $45 value.
