
Naturally there are different levels of underdogs and if you know me by now, you know that I will head to my computer and get all the details. There has been a lot of college football played since 1997, 24-years worth of games.
Let’s look at the biggest favorites and you will see that Las Vegas does its job well picking out big favorites. Since 1997 there have been 782 teams that have been favored by More than 35.5 points in a game. Of those 782 only SEVEN have lost the game straight up. The biggest upset ever was in 2017 when Cam Newton’s little brother guided Howard +45 to and outright upset of UNLV. The biggest upset involving Power 5 teams was when Stanford (+41) upset USC in 2007. In 2015 The Citadel were +38 and upset South Carolina for the 3rd biggest upset ever. 2007 featured the 2nd biggest Power 5 upset when Syracuse (+37) beat Louisville. The other 4 huge upsets since 1997 were: Texas St (+36.5) over Houston in 2012, Temple (+35.5) over Virginia Tech in 1998, Central Michigan (+35.5) over Western Michigan in 2000, James Madison (+35) over Virginia Tech in 2010 and North Texas (+32) over Texas Tech in 1997. Basically, if your team is installed as an underdog of 35.5 points or more in a game, they have a 0.00895% chance of winning.
Now let’s look at the chances of a team winning if they are installed as an underdog of 24.5 to 35 points. Since 1997 there have been 1841 teams that have been favored by 24.5 to 35 points in a game. You would expect the underdogs would have a better chance of winning outright than the above teams and naturally they do. In that span 59 teams that have been favored by that margin have lost straight up. Last year the biggest upset was Kansas St +27.5 upsetting Oklahoma 38-35. Maryland was +27 but pulled an upset of Penn State. The amount of upsets did not go up as much as I thought they would as upsets occurred only 3.2% of the time.
You would figure that the percentage of upsets in the 17.5 to 24 point favorites level would go up drastically from that 3.2% in the previous category. Since 1997 there have been 2,239 teams that have been favored by 17.5 to 24 points. I am still a little surprised that there were only 156 upsets in this level of favorites over the 24-year span. That is just 6.97% upsets, which comes out to 1 upset loss for every 14.4 teams that are favored by 17.5 to 24 points. Last year there were six such upsets. LSU was +23.5 and thanks in part to a shoe toss upset Florida. Michigan St was +22 but took down rival Michigan. Rice was +22 and stunned a ranked undefeated Marshall on the road. Tulsa was +20.5 but upset UCF for a 2nd straight year. Maryland was the first team in FBS history (established 1979) to win consecutive games as a dog of 18+ when they upset Minnesota as a 20.5 dog then Penn St listed above the next week. The other was when New Mexico +18 took down Wyoming.
I will start breaking it down into smaller categories as we continue to go down in level of favoritism. The next category to look at are teams that are favored by 14.5 (more than 2 TD’s) to 17 points. Since 1997 there have been 1454 teams that have been favored by 14.5 to 17 points in a game. Of the 1454 teams favored by this amount 192 have lost the game outright. That is almost double the odds as the category above as 13.2% of the teams favored by 14.5 to 17 points lose outright and an upset occurs 1 time for every 7.6 games played in that level. There were only 6 such upsets last year including Arkansas +17 upsetting Miss St.
The next level down that I will look at is the 10.5 to 14 point category. From 1997 – 2020 there were 2,425 teams that were favored by this level. Of those 2,425 games there were 489 upsets, which was 20.2% of the time. That still means that roughly 4 out of every 5 teams favored by 10.5-14 points wins the game with an upset occurring once every 4.96 times.
From 1997-2020 there were 2,236 teams that were favored by 7.5 to 10 points and of those 2,236 teams there were 581 upsets. That means that 26.0% of the time a team was favored by 7.5 to 10 points they lost outright and that translates into 1 upset every 3.85 games.
Since 1997 there have been 4,199 teams that have been favored from 3.5 to 7 points. These are teams that are expected to win the game, but the game should be close. The last time we tightened up the category the upsets went from every 4.96 games to every 3.85 games. Should we expect 1 in every 3 games here? Since 1997, 1475 of the 4,199 teams that were underdogs of 3.5 to 7 points have pulled outright upsets and that translates into 1 every 2.85 games or 35.1% of the time.
Now we get to the category that will tell us if Las Vegas knows what they are doing. Games where a team is favored by 3 points or less. These games are basically toss-ups but Vegas favors one team and makes them the favorite. What percentage of teams pull minor upsets as underdogs of 3 points or less? As I type this I do not know the answer, but I will guess 45% of them. Now let’s go to the computer. Since 1997 there have been 2,693 favorites of 3 points or less. My 45% guess would have 1212 minor “upsets”. The actual answer is 1279 “upsets” by teams that are underdogs of 3 points or less which comes out to be 47.5% and that shows these games are definitely toss-ups!
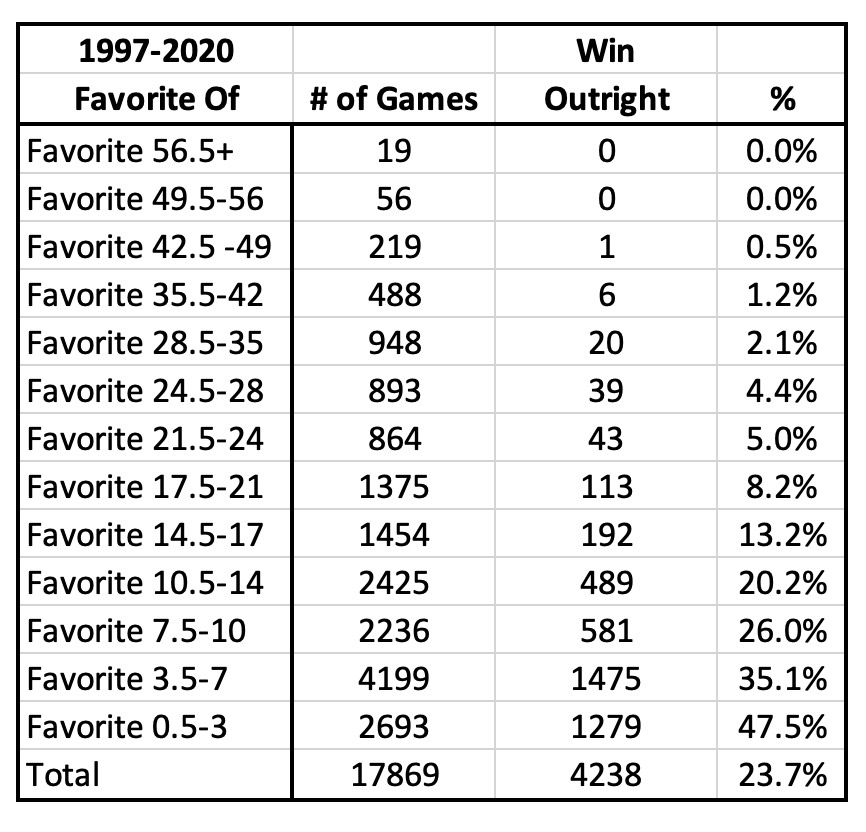
Here is a quick chart showing the chances of a team winning outright depending on where Las Vegas sets the line.
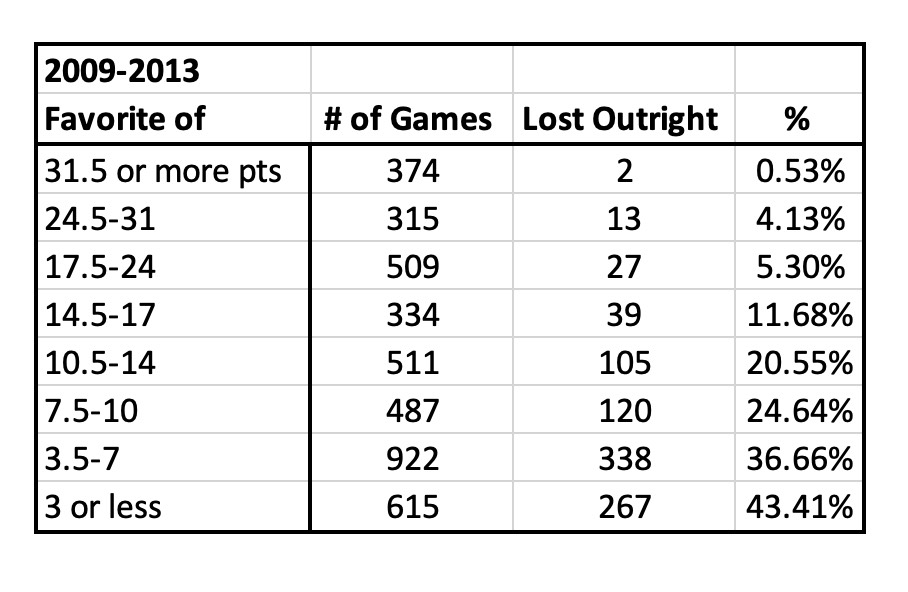
Now instead of looking at 24 years of data, Here is a look at the 5 year period from 2009-13. The numbers were very similar the numbers above.
Now lets take a look at the last 10 years and see if the numbers remain similar. Here are the numbers from the last 10 years.
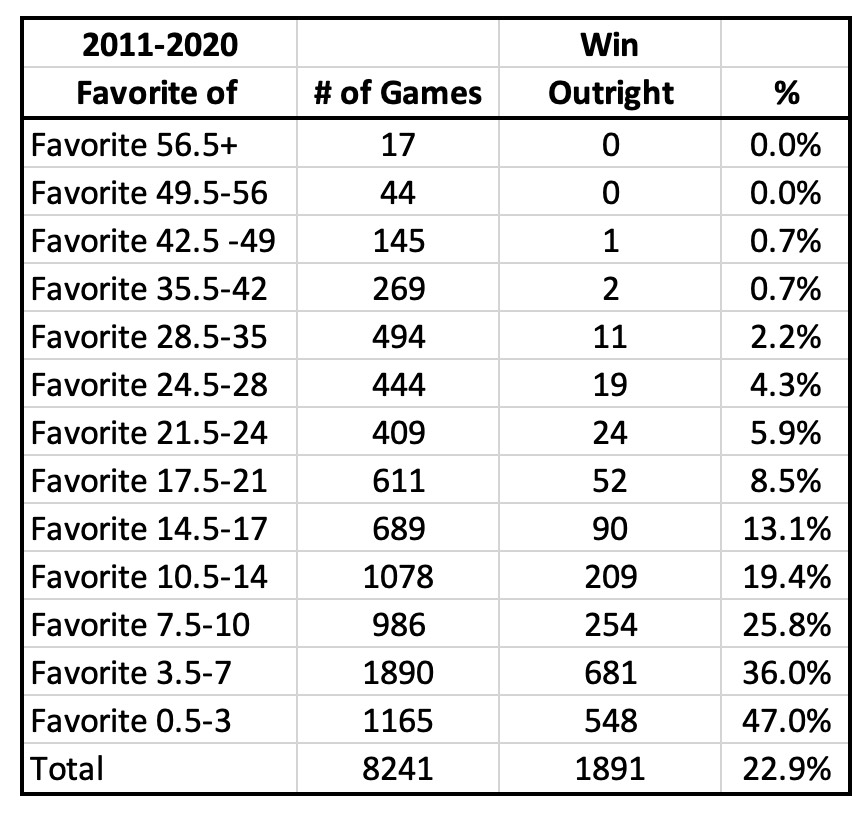
As you can see the numbers continue to remain consistent and not number was really off than more than 1% so we are not trending in any direction just staying steady so this years upset numbers should remain consistent.