On every right-hand team page in the magazine, I list that teams’ current home power ratings. These home ratings go from a low of two points to a high of six points. I have nine sets of power ratings and this is the adjustment I give to the home team.
Is home field really an advantage? As I have mentioned I have a large difference of the adjustment I give to the toughest home teams versus the teams’ with very little home edge. Over the past three years the 136 FBS home teams have compiled a record of 1684-933 in home games for a winning percentage of 64.3%. Over the last five years the record has remained consistent with FBS teams having a combined 2765-1559 63.9% edge. This is the 32nd year of the magazine and there has never been a year in that span where home teams won under 50% of their games.
This is a multi-part series, and I will go thru all the factors that I use to determine my current home power rating number for each team. Those five factors that I look at are:
- Straight Up Home Record last year, last 3 years, last 5 years.
- Average Attendance for each school and percentage crowd is of the stadium.
- My home and away Game Grades for each team for current year
- ATS Records last year, last 3 years, last 5 years average.
- My personal influence. Sometimes it is not the size of the crowd but the loudness and intensity of the crowd during the game. Other factors I use my personal judgment are would be altitude and travel time.
Today I am going to look at my Average Game Grades for each team when they play at home and how much that differs from their Road Average Game Grade. Let me first explain what my Average Game Grade is. When I started my magazine, I had developed a formula which matched up the rush offense of one team, versus the rush defense of their upcoming opponent and gave a projected amount of rush yards. I devised the formula for pass offense vs pass defense and points offense versus points defense. This formula than projected the results for the upcoming game. Each teams power rating is not adjusted by the total yards or total points but rather by the difference from what was expected. Let me give you an example from 2022 of what I mean. If you based it just on the yards gained and adjusted your power rating, then Tennessee rushing for 250 yards versus Louisiana Tech would naturally be better than rushing for just 175 yards versus Georgia. My Power rating system however would grade the performance versus Georgia as much stronger. Georgia led the nation in rush defense allowing just 77.1 ypg and 2.88 ypc. My computer would have forecast Tennessee to rush for 106 yards vs the tough Bulldog rush D. Louisiana Tech was at the other end of the spectrum with their rush D allowing 243 rush yards per game and 6.12 ypc. Those totals came against weaker rush offenses than Tennessee! My computer would have forecast Tennessee to rush for 326 rush yards. Tennessee rushing for 175 versus Georgia would have raised their power ratings as they exceeded expectations. Rushing for 250 yards vs Louisiana Tech’s porous rush defense would have lowered their grade!
To get an average game grade I just reversed the formula. I have the opponents’ grades for all the categories and after the game is over, we have the actual stats. I will use some basic numbers to make it simple. If team A has a rush offense of 10 and team B has a rush defense rated at 7, then team A should rush for 200 yards. Now if the game has been played, I just take the opponent rush defense of 7 reverse the chart and say that rushing for 200 yards versus a 7-level rush defense would equate to being a 10 rush offense. I then add up the power ratings of what the team actually achieved and that equates to an Average Game Grade. My average game grades also add in a home field advantage to the expectation level.
Now that you know what the average game grade is, yesterday I started by showing you what level each team has played to at home the last 3 years. Click HERE For yesterdays blog
Much like the straight up records of teams at home, that chart favored the Blue Bloods and the best teams of football. A team like Georgia in 2022 played to a 120.1 level at home which was #2 but played to a 124.23 level on the road which was the nation’s best. That means that their Away Average Game Grade was better than their Home Average Game Grade. In 2023 Michigan played to a strong 117.8 AGG at home which was #8 in the country. They played at a 127.7 AGG on the road which was 9.5 points stronger and the best road AGG. In 2024 a team like Notre Dame played to a stronger level on the road than they did at home (lost to NIllinois). North Carolina was 0-7 ATS at home and played to a 109.3 AGG on the road and just a 97.1 AGG at home.
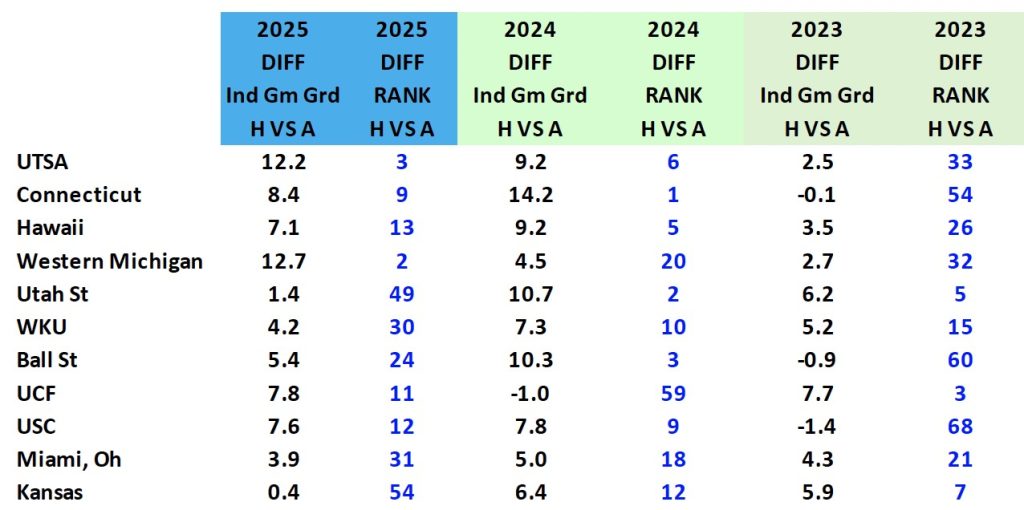
Today, I will break down which teams played to the highest level at home vs how they did on the road. Naturally most of the stronger teams will play at a higher level than the weaker teams. To balance it out, I also look at the home and away differences for each team from each of the last 3 years. Here is the chart.
Just like yesterday, I weighted the years with 40% of 2025, 32.5% of 2024 and 27.5% of 2023 (remember I do not include 2020 in the home field factors). When I last did this blog back in 2019 Three Group of Five teams with underrated home fields were near the top in East Carolina, Old Dominion, and UAB. Georgia actually played more inspired on the road in front of enemy fans as they have had a higher Away Average Game Grade all three years. Back in 2018 Army played 27.0 points per game higher on the road than they did at home and that huge number had them #130 in this category. At home they outscored teams by just 7 points per game and that included three teams that were in the FCS in 2017! On the road they took Oklahoma to OT and had a 26-19 FD edge. On the road they outscored their foes by a 40-15 average and that included beating three bowl teams by 29, 15 and 56! Army has also had a higher number on the road each of the last 4 years. You would expect a service academy to travel well. In 2022 Northern Illinois topped the charts for teams that played better on the road than at home. The Huskies only beat Eastern Illinois by 7 (outgained by 62 yards) and lost their other 5 home games despite being favored in four of those five games! They upset Eastern and Western Michigan on the road with one OT loss and 3-, 8- and 7-point losses in their other 3 road games. In ‘23 Arkansas was the team that played better on the road than at home. While the Hogs were 0-6 ATS at home vs FBS foes and lost outright to BYU, Miss St and Auburn as a favorite, they were much tougher on the road. They lost to LSU by 3, Ole Miss by 7, Alabama by 3 and upset Florida in the Swamp. They were 20.8 points stronger in my AGG on the road than at home. Last year Wake Forest was 0-6 SU at home vs FBS teams but 3-2 SU on the road.
Louisville was at the top of the chart in ’23 as they lost to a powerful Florida St team by 4 at home and were 5-0 in their other home games including wins over 4 bowl foes and their average win was by 23.6 ppg. They were 2-4 on the road with 3 losses by double digits. In 2023 Syracuse is at the top playing 13.6 points better in my AGG at home than on the road. Oklahoma was #2 as they won their home games by 31 ppg and were +175 ypg in those while on the road they were upset by Kansas and Oklahoma St and struggled vs Cincy and BYU. The Sooners were #1 in the 3-year rankings for difference and that helped their home field edge power ratings.
Last year Florida St had the biggest difference playing to a 123.2 level at home and -109.0 for a 14.2 difference. Western Michigan had a 12.7 difference with UTSA a 12.2 difference followed by Iowa St, Akron, Kentucky, Illinois and Nebraska. These are the teams that were much better at home than away. The teams that had the biggest difference with stronger road grades than home grades were Syracuse, Clemson, South Alabama, Michigan St, Troy and Kansas St.
For my overall computations I consider the last FIVE years in each of these categories but that would have been too many numbers to digest for this blog, so I am just showing the last 3 years. In the formula it is always weighted with the current past year getting the largest part of the grade.
The team with the largest three-year difference would have been my first guess without looking at any numbers. UTSA has been unbeatable at home but loses a lot on the road. They top the charts at +7.99 over the 3 years. Hawaii is no surprise as it is a long flight to and from the mainland. USC has struggled on the road in the move to the Big Ten but been solid at home with the long flights helping the home team in their games. Arkansas is at the bottom and coach Pittman always had his teams prepped on the road vs ranked teams and suffered many close losses in those which would result in a high road AGG. Arizona St playing in the desert is a surprise to be near the bottom and has played to a higher AGG on the road than at home each of the last three years.
Last year I added a column showing the largest differences between 2024 and the ratings from 2023 and 2022 combined. I highlighted those teams that made the largest moves up the rankings in Green.
2024 Biggest rise in rankings from 2022-23 average.
- Buffalo
- Wash St
- Purdue
- Kennesaw St
- Liberty
- Central Michigan
- New Mexico St
- Eastern Michigan
- Ball State
- Missouri
I provided it on the chart once again this year. Here are the teams that took the biggest jump in the difference between home and away AGG in 2025.
2025 Biggest rise in rankings from 2023-24 average.
- Akron
- Kentucky
- Iowa St
- Michigan
- Old Dominion
- Wake Forest
- Florida State
- BYU
- Illinois
- Georgia St
- Nebraska
Rutgers was very tough at home in 2022 and 2023 but last year were -17.0 points from their home AGG grade vs the road AGG grade in ’24. Taking away the Howard and Akron games Rutgers was -110 ypg at home and just -3 ypg on the road. Here were the top ten in teams whose home field AGG vs their road AGG dropped the most in 2024 from their 2022-23 average
2024 H/A average drops most from 2022-23 average.
- Rutgers
- TCU
- North Carolina
- LSU
- Miss St
- Oklahoma St
- Toledo
- Memphis
- Ole Miss
- Utah
Last year Syracuse went from being #1 in 2023 in being stronger at home than on the road to the complete opposite end of the spectrum and finished the polar opposite at #136 in 2025! The Orange had similar stats home and away but at home faced Connecticut, Colgate, Duke, Pitt, North Carolina and Boston College. On the road they faced Tennessee, Clemson, SMU, Georgia Tech, Miami and Notre Dame so they had a 103.4 AGG on the road and just an 80.5 AGG at home. Here are the teams that had the biggest drop off in Home/Away AGG difference in 2025.
2025 H/A average drops most from 2023-24 average.
- Syracuse
- Southern Miss
- Tennessee
- Kansas St
- Troy
- South Alabama
- Texas Tech
- Duke
- Temple
- Texas A&M
In the next Homefield edge blog I take a look at how I factor in Attendance into the equation of Home Field edge.
This years magazine is 376 pages and the biggest and best ever. Here are the different ways you can order the magazine.
Option #1 – Pick one up at your local Barnes and Noble or Books-a-Million store. When you go into a Barnes and Noble you get two different cover choices in each store! The official on sale date is July 4th but it is hitting some stores sooner. It is also available at Books-a-Million which all have the national cover. These two distributors are our exclusive vendors of the magazine, and they are not available at Walmart’s, Walgreens, Grocery Stores, other bookstores or drug stores so save your gas. The only two brick and mortar store they are available are Barnes and Noble and Books-A-Million.
Option #2 – Buy the Hard copy of the magazine at philsteele.com or call 1-866-918-7711. The total cost depends on where you live and which of the four types of shipping you choose. It will cost you in the ballpark of $10 for shipping and tax. The biggest advantage of buying online is that When you buy the Hard copy you GET the DIGITAL version of the magazine ($19.99) for FREE and it is updated thru September. Your digital access begins immediately when you purchase. You also get your choice of covers (National, SEC, Midwest, Southwest, West or East Coast) as these are generally mailed out the same or next business day as the order. Order Here!
Option #3 – Buy the digital magazine. The best thing about the digital magazine is that it is updated all the way thru the month of September. If a coach gets fired (that has happened the last couple of years) we update it. If a player is injured and out for the year we CIRCLE him in the magazine. If a player is added late (very rare) we put him in. Any changes to the team from the start of June thru the month of September is updated in the digital version. When you go to the philsteele.com store you will not see a picture there, you need to click on Digital Editions and order it there. It will be activated immediately giving you instant access. Order the Digital Here!
Option #4 – Order the VIP Bundle – The price of the VIP bundle is $44.95. With the VIP bundle you get the National Cover of the magazine. All VIP’s received EXCLUSIVE ACCESS to the digital version of the magazine for one week, but that bonus is gone as the digital is now available for everyone. You receive two magazines PLUS the Digital Magazine. You also receive FOUR Free issues of my Inside the Pressbox Newsletter ($20 per issue – $80 value) which gives you my Forecast and my computers forecast on EVERY FBS game each week. You also receive access to Phil Steele Plus ($25 per month) for the months of June, July, August and September! The VIP Bundle also includes SHIPPING so it is basically just $10 more than ordering the magazine by itself! Order the Reg VIP Bundle Here!!
Option #5 – THE BEST BUY – Order the Super VIP Bundle – The price of the SUPER VIP bundle is $74.95. With the Super VIP Bundle you receive
TWO magazines INCLUDING SHIPPING ($69 value!), EXCLUSIVE ACCESS to the digital version for one week (that happened already), order shipped next business day. Use the 2nd magazine when your first one gets dogeared or sell/give it to a friend.
Digital magazine ($19.95 value) FREE – The digital magazine is updated thru September (see option 3) and you get immediate access to the digital version upon purchase.
Four Issues of my Inside the Pressbox newsletter ($80 value) which gives you my forecast and my COMPUTERs forecast on EVERY FBS games each week (including FBS vs FCS) the same bonuses that the VIP’s get. You also receive…
FCS Digital Magazine ($25) FREE – Two full pages on Every FCS team laid out the same way the pages are for the FBS magazine. There are 128 FCS teams so over 250 pages!
NFL Digital Magazine ($15) FREE – Four full pages on Every NFL team and a Fantasy Football section!
Phil Steele Plus ($99 value) ENTIRE SEASON FREE – This is a tremendous addition. If you purchase the full year access to Phil Steele Plus it is $99 but you get it included in the Super VIP Bundle Purchase the Super VIP Bundle now and get the entire year of Phil Steele Plus FREE!! Here is a link to all the great info available on Phil Steele Plus including the schedule predictor! Order the Super VIP Bundle Here!!
