On every right-hand team page in the magazine, I list that teams’ current home power ratings. These home ratings go from a low of two points to a high of six points. I have nine sets of power ratings and this is the adjustment I give to the home team.
Is home field really an advantage? As I mentioned I have a large difference of the adjustment I give to the toughest home teams versus the teams’ with very little home edge. Over the past three years the 130 FBS home teams have compiled a record of 1,544-909 in home game for a winning percentage of 62.9%. Over the last five years the record has remained consistent with FBS teams having a combined 2,532-1,537 62.2% edge. This is the 25th year of the magazine and there has never been a year in that span where home teams won under 50% of their games.
This is a five-part series and I will go thru all of the factors that I use to determine my current home power rating number for each team. Those five factors that I look at are:
- Straight Up Home Record last year, last 3 years, last 5 years
- Average Attendance for each school and percentage crowd is of the stadium
- My home and away Game Grades for each team for current year, 3 year and 5 yearATS Record last year, last 3 years, last 5 yearsAverage
- ATS Record last year, last 3 years, last 5 yearsAverage
- My personal influence. Sometimes it is not the size of the crowd but the loudness and intensity of the crowd during the game. Other factors I use my personal judgment are would be altitude and travel time.
I will start out by looking at each teams’ record at home over the past three and the past five year. My formula does weight the most recent year but gives a little more weight to the three and five-year totals. The clearest examples of how a team can differ from year to year come from a Pac 12 team, Big 12 team and American Conference team. In 2017 UCLA was a completely different team at home than they were away. UCLA won every one of their home games going 6-0 but went 0-7 away from the Rose Bowl. Last year in the first year under Chip Kelly they actually went just 2-4 at home. Baylor had zero home field edge in 2017 as they went winless even losing to teams like Liberty and UTSA! Last year the Bears went 4-2 at home and 2-4 on the road. Cincinnati was 1-4 versus FBS teams at home in 2017 edging lowly Connecticut 22-21. Last year the Bearcats had a large turnaround and a big part of that was a stronger home field edge as they went 6-0 and won their games by an average of 45-15!
I think everyone has a good idea how their favorite team did last year. There were 17 teams in alphabetical order were: Alabama, Appalachian St, Army, Cincinnati, Clemson, Fresno St, Georgia, Michigan, Notre Dame, Ohio U, Ohio State, Oklahoma, Syracuse, UAB, UCF, Utah State and Washington. Here are the 130 teams ranked in order of home record the last three years.
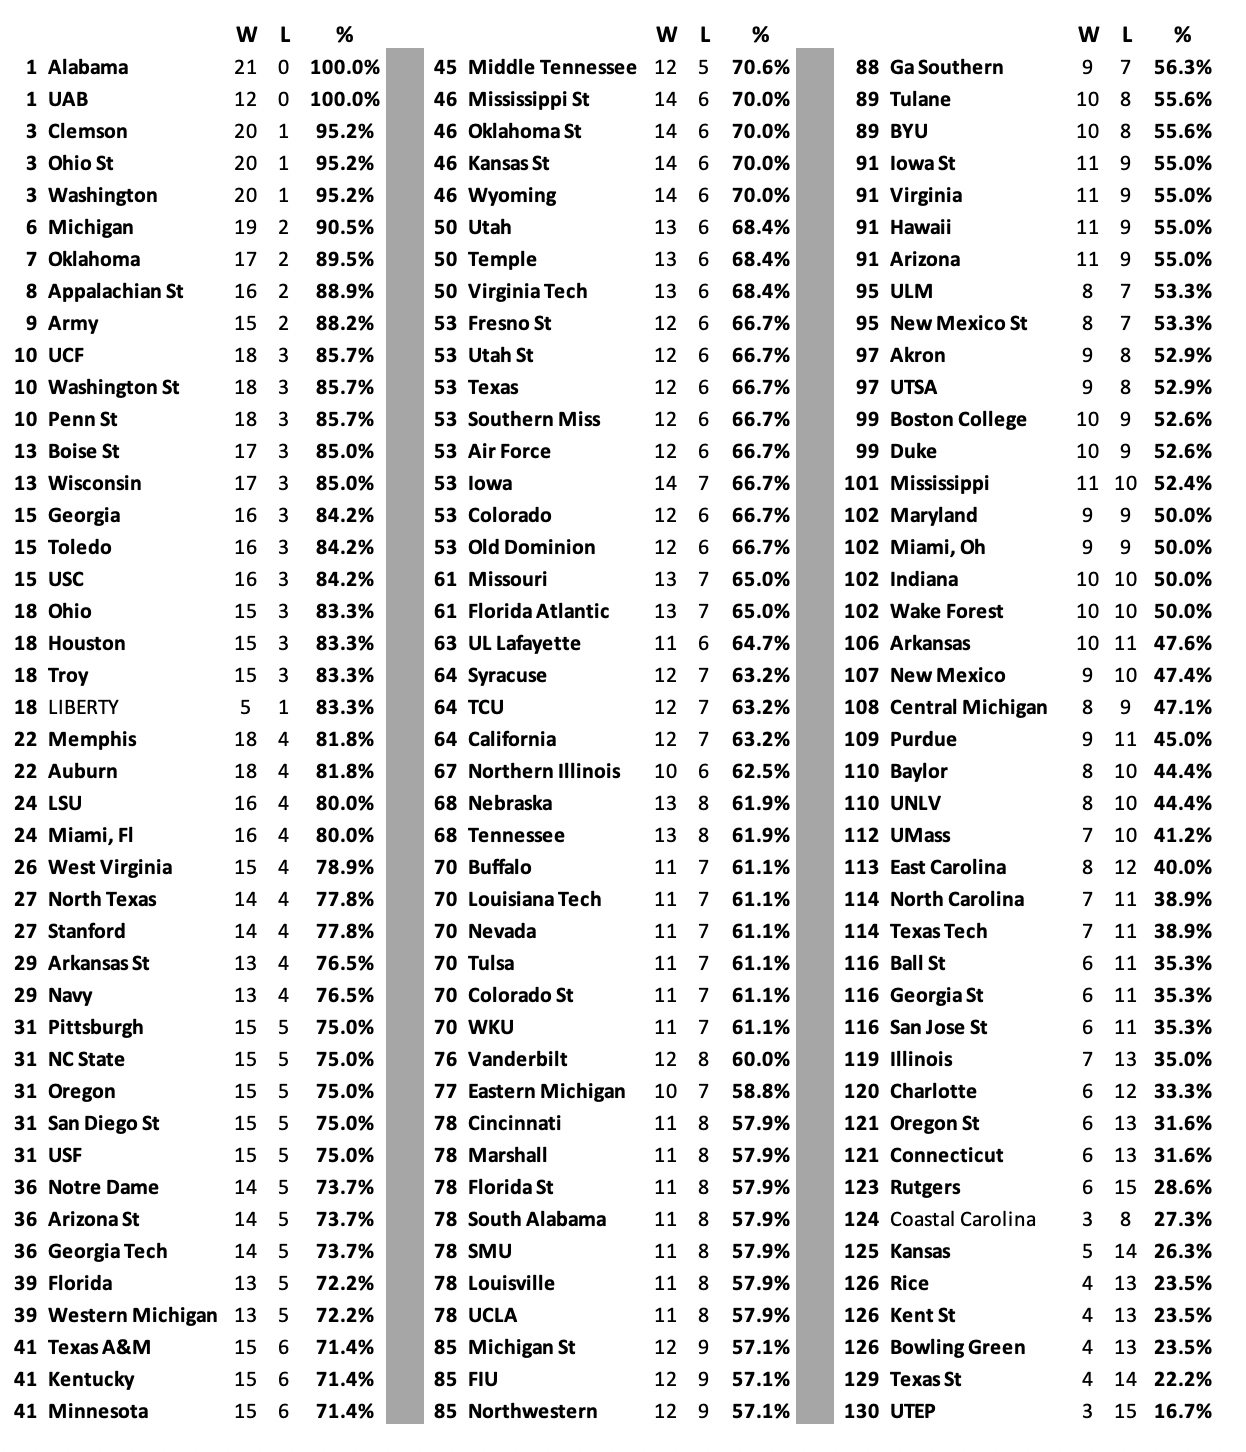
Only two teams are unbeaten the last three years and UAB only played two of those seasons. Alabama has rolled to a perfect 21-0 record. If you are wondering Clemson lost at home to Pitt three years ago for a 20-1 record the same as both Ohio State and Washington.
Now I will take a look at exactly how teams have fared at home over the last five years. I have left out both Coastal Carolina and Liberty.
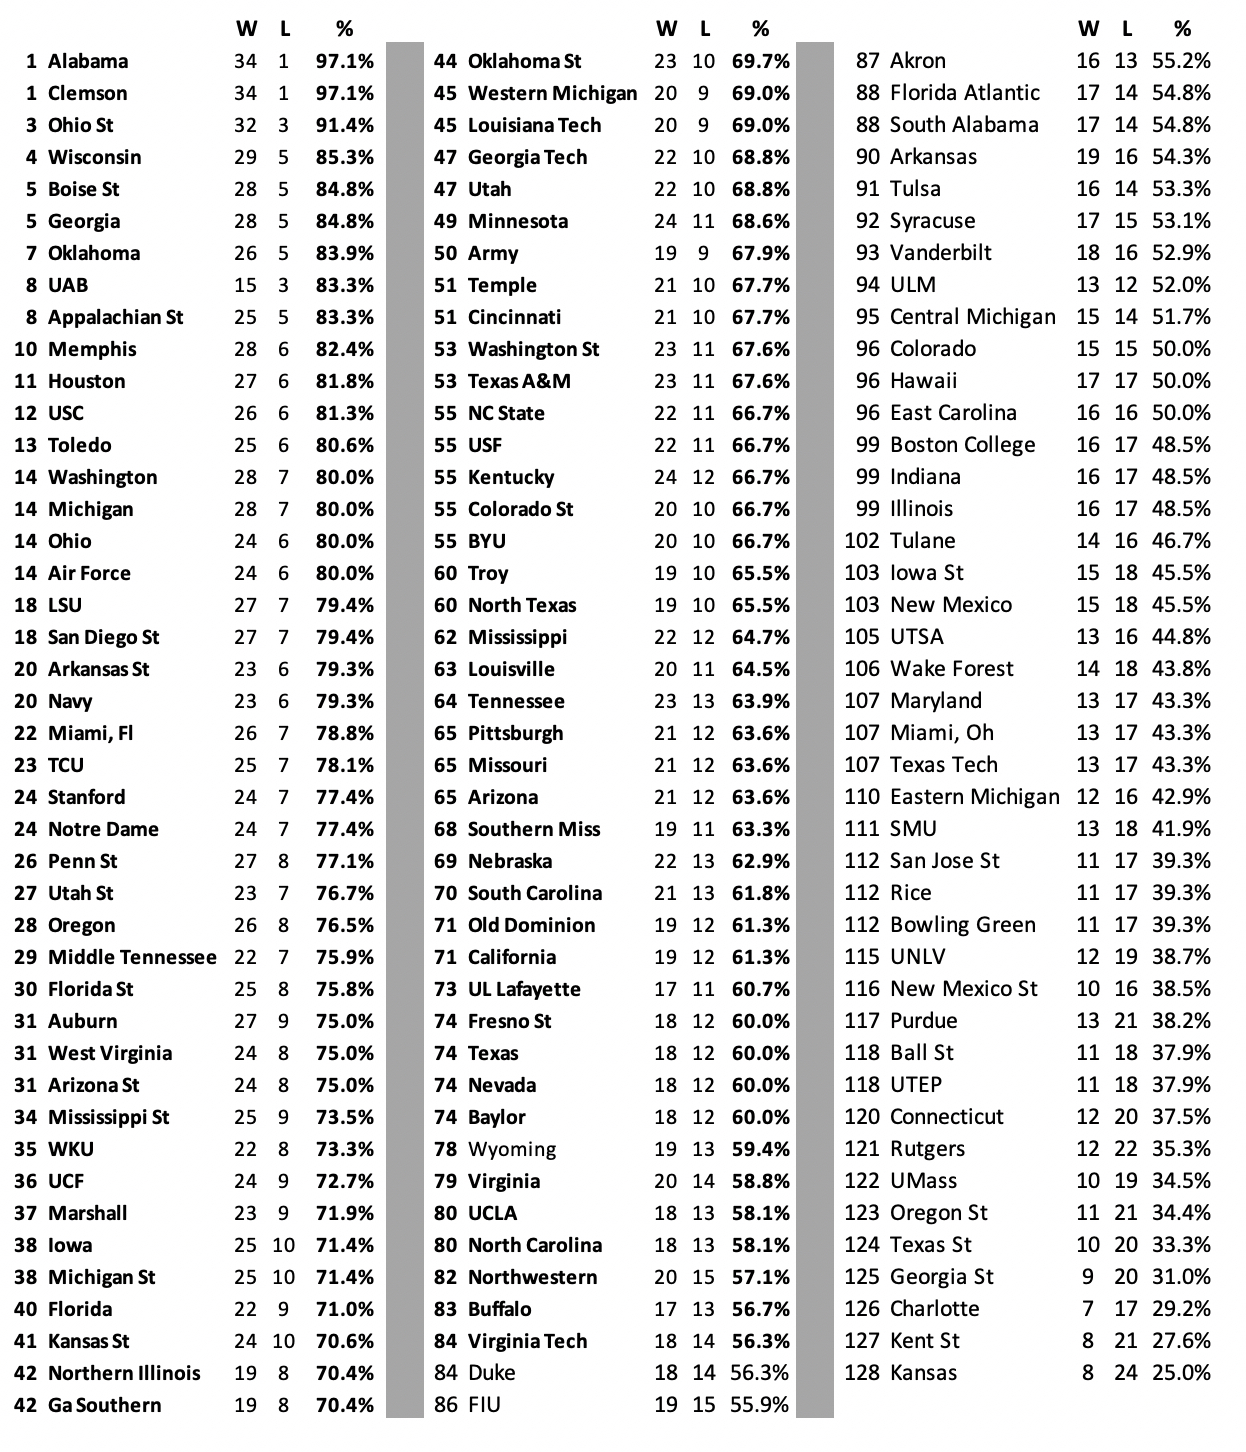
As you would expect Alabama and Clemson are tied at the top with both teams having just one home loss total over of the last five years. Ohio State comes in 32-3 while Wisconsin, Boise St, Georgia and Oklahoma have each averaged exactly one loss at home per year over this span. Kansas fans may not remember them all, but the Jayhawks have won eight games the last five years at home.
On Monday we will take a look at average Attendance for each school and percentage crowd is of the stadium.