This article was in my very first magazine back in 1995 and really got me hooked on uncovering different metrics to help me forecast how teams will fare the next year. That year I went back and looked at three years worth of information on teams that had double-digit turnovers the previous year. The data from those three years showed that teams that benefitted from double-digit turnovers one year had a weaker or the same record 75% of the time. The opposite was true for teams off a season with a negative double-digit turnover ratio.
That first magazine was just 192 pages and printed on black and white newsprint. There have been many changes in the world since 1995 and a lot of changes with the magazine, which is now full color and almost double the size. There has been one constant over the 28 years and that is the results of the Turnovers Equals Turnaround article which continues to hit at least 67% on a yearly basis. If anything, the results are getting stronger as the last eleven years 71 teams have benefitted from +14 turnovers or more. The next season they had the weaker or same record 89.9% of the time. Last year there were 23 team with -7 TO or more and 13 improved their record, 2 got weaker and 8 had the same. 26 teams had +7 TO or more and 4 got better, 19 weaker, 3 same. That is 32-6-11 combined for the correct result.
This year with the return of the digital FCS magazine I have gone back and done the research for the last 5 years for the FCS and I am very pleased with the results!!! I have looked at 2016, 2017, 2018, 2019 and 2022. There was no sense looking at 2020 as they played in the spring with some teams not playing, some playing 2 or 5 games schedule and very few playing anywhere near a full schedule. There was also no sense of looking at 2021 as it would have been based off the turnovers of that strange 2020 Fall/2021 Spring season.
The results were great at teams that even had -5 Turnovers the previous year improved their record 113 time, had the same record 19 times and only 40 had a weaker record for a 76.7% success rate.
On the flip side team that were +7 or more Turnovers last year 71 had a weaker record the next year, 14 had the same record and only 25 managed to improve thier record. That is a success rate of 77.3%.
This is the article that got me going on all the different metrics that I use in the magazine. What turned out to be 3 years of research has now grown into 32 years, encompassing from 1990-2022. This is the first year of this FCS article but it has been a proven success for 28 years in the FBS magazine. Here are this year’s Turnaround teams.
Teams that suffered bad breaks the year before are usually headed for better fortune the following season. In the past 33 years, there have been 399 FBS teams that finished the season minus double-digits in TO’s. Of those 399 teams, 266 (67%) have had better records the next year! Teams with a negative double-digit TO ratio had the same or stronger records 77% of the time since 1991.
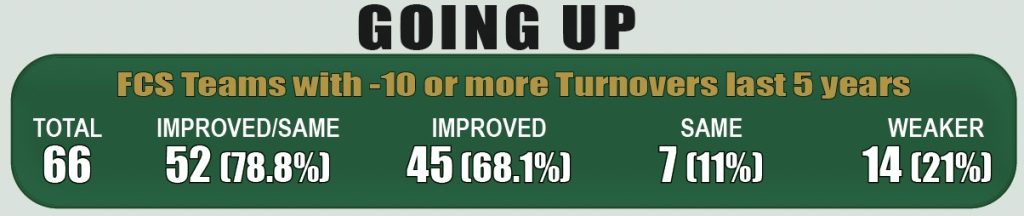
In my five years of research for the FCS the numbers were even a little stronger. There have been 66 teams in that span that were coming off a season of -10 turnovers or more and the chart above shows you a 78.8% success rate! Teams at -13 or more had a 84% success rate and those at -16 or more were at a 92% success rate!
Let’s take a look at some teams who had terrible luck (a lot of TO’s) in one year then drastically improved the next year without those negative TO’s.
Austin Peay was 0-11 in 2016 but were -11 in turnovers. In 2017 they were net 0 in TO’s and improved all the way to 8-4 under Will Healy.
Indiana St was -13 in turnovers in 2017 and went just 0-11. The next year they were actually +9 in TO’s and improved all the way up to 7-4! The Stock Market Indicator and TO’s would both have had them regressing in 2019 and they dropped back to 5-7.
Incarnate Word was -16 in TO’s in 2017 and just 1-10 but +4 in TO’s in 2018 and improved to 6-5.
Last year Idaho, Western Carolina and Prarie View A&M were all off season of – double digit turnover and all 3 managed to go from a losing record to a winning record!
As mentioned above even teams that were -5 in turnovers or more had a 76.7% success rate in having either a stronger or the same record the next year.
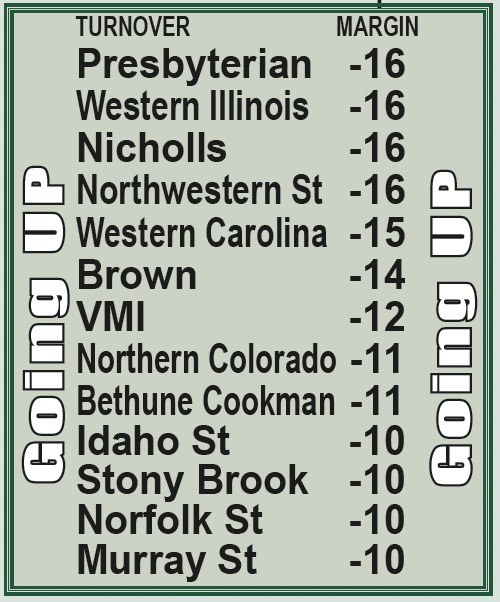
In the box below is this years Going UP teams that had the worse turnover luck last year.
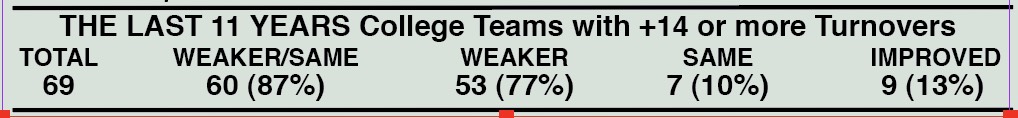
Teams that benefitted from double-digit turnovers the previous year rarely get a repeat of that good fortune. In the last 33 years, 494 teams have had plus double-digit turnovers. Of those 494, 317 have had weaker records the following year (64%). Only 136 teams (27.5%) have improved their record and the other 41 (8%) finished with the same record. Teams with a positive double-digit TO ratio have had the same or weaker records 72% of the time since 1990. If we tighten the parameters to +14 TO’s over the last eleven years, just 9 (13.6%) of those 66 teams have had an improved record.
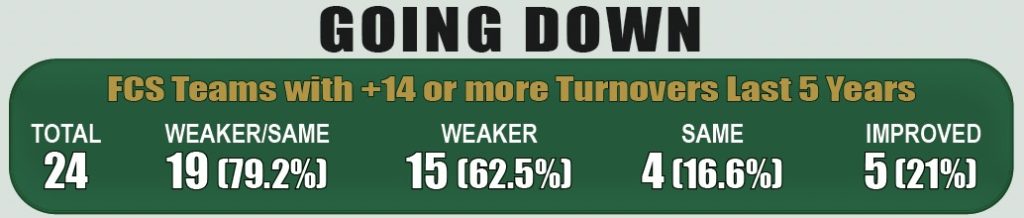
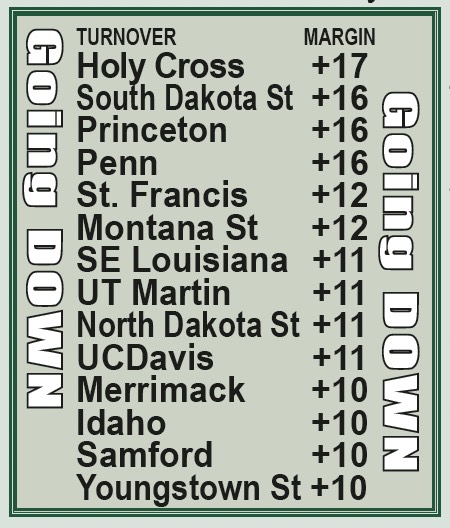
In my five years of research for the FCS the numbers are very similar. For the 24 teams that benefitted from +14 or more in TO’s the previous year 15 had a weaker record, 4 had the same and only 5 improved for 79% success. There were 60 teams at +10 or higher and that had a 75% success rate of teams having a weaker or the same record. Teams from +7 to +9 were even better with 50 teams in that category and only 10 improved their record for an 80% success rate!
Here are some examples. In 2017 Southern Utah was 9-3 but +11 in TO’s. The next year they fell to 1-10 with a -4 TO margin. In 2021 ETennSt was +13 in TO’s and had a great 11-2 season. Last year they were just +2 in TO’s and fell to 3-8.
In 2018 Colgate was +15 in TO’s and 10-2. In 2019 they went to -2 in TO’s and were just 4-8. In 2021 Eastern Washington was 10-3 and +12 in TO’s but dropped to 3-8 last year.
In the box below is this years Going Down teams that has the bestturnover luck last year and might not be as fortunate this year.
You can also get this info by checking out our brand new 2023 Digital FCS Magazine for $25. Two Full Pages on EVERY FCS Team updated thru September – If you buy the magazine today you will notice that today’s version is not 100% complete but with 80% of the information done and this being a digital version, I wanted to let you get started on your 2023 prep for the FCS. I will have a set of power ratings, complete conference forecasts and more added plus any missing pages should be updated in the next week or so. You could become an expert on FCS teams just like you are on any FBS team when you read their team page. It is just $25 with no shipping or handling charges, and you can have access to it right now. Interested in getting a copy FCS Digital magazine Click Here.