I have been tracking the Conference YPG vs conference record from 2001 all the way thru this past year so I have 20 years of research invested in this Metric. It seems like right now a lot of people use Metrics. Way back in 1995, I put the first Metric article (Metrics was not a term back then) into the magazine and it was Turnovers = Turnaround. That article had five years of research put into it and has stayed true to form with now 33 years of research into it and remains a 75% accurate indicator of teams either going up or down the next season. Since that first article, I have added a bunch of Metrics to the magazine. While I have referred to the Conference YPG in plenty of team writeups, I have never put the actual article into my magazine but it has had great success.
This year I am writing the article for philsteele.com and next year this article will likely find its way into the magazine for the first time.
My hypothesis behind the article were that teams that outgained their conference foes but finished with a losing record were much better than their record and would likely improve the next season. On the flip side, teams that were outgained but caught a lot of breaks and finished with a winning record would be overvalued and likely have a weaker record the next year.
I am a math guy and I had to come up with a formula to figure out how many yards translated into wins and or losses. Studying the previous years’ standings, I came up with 35 yards per game (ypg) per win above .500. My formula took the total ypg divided by the 35 ypg I credited for each game above .500 on the season and then added in half of the games played. As an example, a team that was 0 ypg on the year and played an eight-game schedule should have four wins on the year. (35/0= 0+4 for half the games played). If a team played an eight-game schedule and went 8-0 they should be +140 ypg. If a team went 6-2 they should be +70 ypg. If a team played a nine-game schedule than +52.5 ypg would be the mark for a 6-3 season and a 9-0 season would be if a team was 158 ypg. It works the same for negative ypg which translates into losing record. In an eight game schedule you would start with 4 wins (0 ypg) and then add in the negative number. If a team was -105 ypg and would be -3 or just 1 win for the season is what they should have achieved.
Let me give you some numbers from past years so you get an understanding of how this Metric works.
In 2020 Tulsa was at the top of the Going Up Box for this metric. Tulsa was a poor 2-6 in conference play in 2019 but was only -5 ypg. Tulsa rated a +3.29 in my Conference YPG vs Wins. The next year in 2020 they were in the AAC title game vs Cincinnati. At the opposite end of the spectrum, Baylor was 8-1 in the Big 12 but only +23 ypg in 2019 which would be more indicative of a .500 year. The next year in 2020 Baylor went just 2-7.
In 2019 Florida Atlantic was at the top of the Going Up Box for this metric. FAU was +87 ypg in CUSA play in 2018 but just 3-5 in conference play. That had them at a +3.5 in my Conference YPG vs Wins metric. The next year 2020, FAU went 7-1 in CUSA play and won the conference. At the bottom of the metric was Northwestern. The Wildcats were an AMAZING 8-1 in conference play in 2018 but were ACTUALLY -43 ypg in Big Ten Play! The next year Northwestern rated a -4.3 in this metric and while they had similar yards at -58 ypg their record ended up just 1-8 for a major step back.
In 2018 Baylor was near the top of the charts at +2.4 as they were 1-8 in Big 12 play in 2017 but only -40 ypg and in 2018 Baylor improved to 7-6 overall and 4-5 in conference play. Akron rated a -4.7 on my Conference YPG vs Wins metric as in 2017 they were 6-3 in MAC play but did it with mirrors as they were outgained by 103 ypg in conference play. As you would expect, the next year Akron tumbled to 2-6 in the MAC and 4-8 overall.
In 2017 Michigan St was at the top of the Going Up box as in 2016 the Spartans were +35 ypg in conference play but not only finished with a losing record but were 1-8!! My Conference YPG vs Wins metric at a +4.5 and as you would expect the Spartans were much better in 2017 as they were from 3-9 overall to 10-3 and 7-2 in Conference play. Georgia Tech was in the Going Down Box for 2017 as in 2016 the Yellow Jackets were 9-4 overall but were -86 ypg in Conference play. In 2017 Georgia Tech dropped to 5-6 overall.
Here is the chart for how this metric has done.
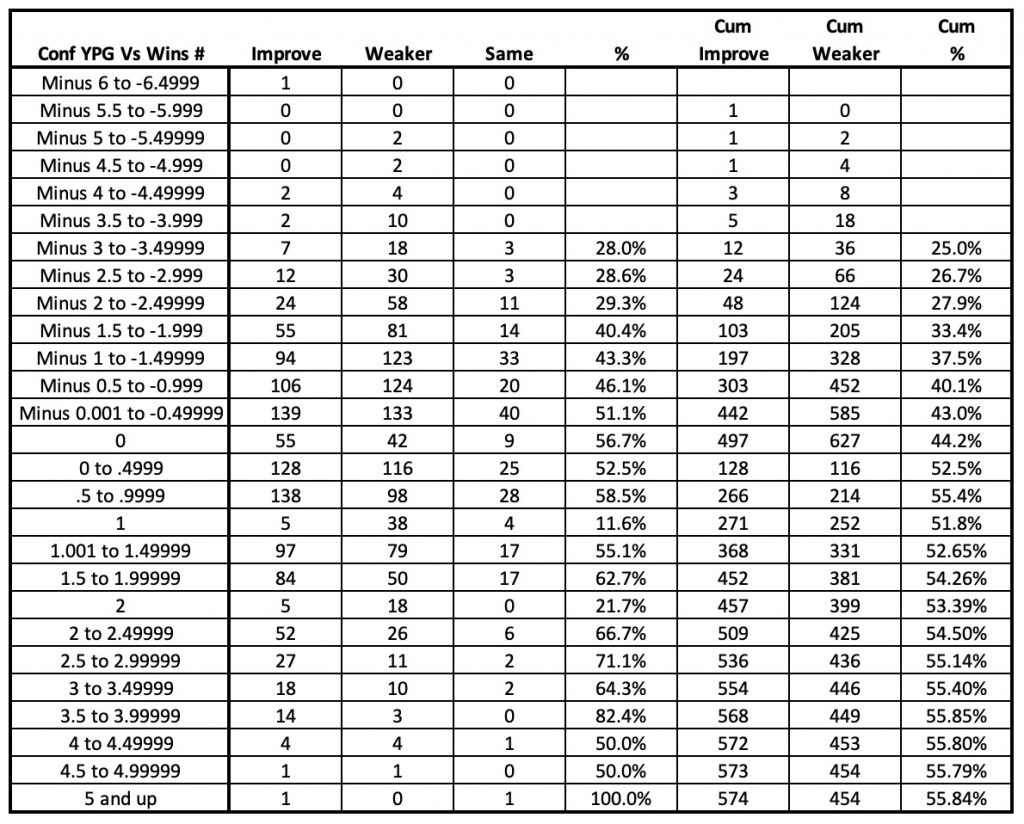
Since 2001 there have only been five teams rated at -4.5 or lower and of those 5 teams, four had a weaker record the next year. Now you know I think Bill Snyder was one of the greatest head coaches of all time. Somehow in 2011 his Kansas St Wildcats were -107 ypg yet, 6-2 in Big 12 play. That rated them a -6.051. The next year somehow Snyder had them 8-1 in the Big 12 including a win over Texas in the Big 12 title game to be the only team to buck they metric at that level. Teams that are -2 or more have had a weaker or the same record 141 of 189 times for 75%. As you see on the chart the percentages work out perfectly with the records for teams in the negative category getting weaker as the negative points rise.
On the positive side it is unusual that teams that rate a +1.0 and +2.0 have actually had negative records with the two combining to improve their record just 10 times while having a weaker or the same record 60 times! The reason for this is if a team that was 7-1 or 8-1 had an indicator saying they should have won 9 or 10+ games, I bring that back down to +1 +2 as you cannot win more games than are played. These are teams that are right at the top of the chart with just 1 loss the previous year. This year Oklahoma St and WKU fit into that category so both will likely have weaker records despite the plus sign in front of the indicator. All the other numbers on the positive chart work out perfectly as the percentages go up for each level until reaching the top. Teams rated +2.01 or higher have improved or had the same record 129 times while having a weaker record 55 times for a 70.1% success rate.
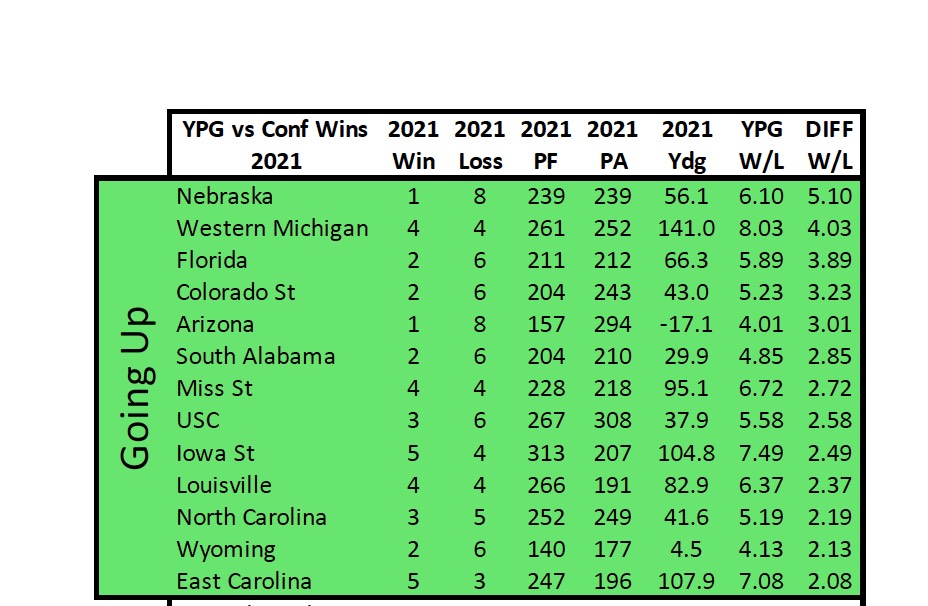
Now let us take a look at which teams make the Going Up Box and which teams are headed down for 2022 according to the Conference YPG vs Wins Metric. The Big Ten actually has two teams that are at historically high levels. Last year Nebraska was 1-8 in Big Ten play but was +56 ypg which puts them at +5.1! Michigan St went 7-2 in Big Ten Play but were just -62.4 ypg which puts them at a -4.28 and the king of the Going Down Box. There are 14 teams rated +2.06 or higher this year which means they have a 70% chance of a better season. Those 14 teams are in the GREEN GOING UP BOX. There are nine teams in the Going Down box that are rated at -2.01 or better. Only 28% of teams in this category improve their record and if I was to pick the two outliers from this group it would be Clemson and UCF as I expect both to improve their records.
Here is the Conference YPG Wins chart with the Top Teams in GREEN in the GOING UP box and the bottom teams in RED in the Going Down box.
I hope you enjoyed todays blog and I will have one each and every day leading up to football season so make sure you check back daily.