I have been tracking the Conference YPG vs conference record from 2001 all the way through this past year so I have 25 years of research invested in this Metric. It seems like right now a lot of people use Metrics. Way back in 1995, I put the first Metric article (Metrics was not a term back then) into the magazine and it was Turnovers = Turnaround. That article had five years of research put into it and has stayed true to form with now 36 years of research into it and remains a 75% accurate indicator of teams either going up or down the next season. Since that first article, I have added a bunch of Metrics to the magazine. While I have referred to the Conference YPG in plenty of team write-ups, I have never put the actual article into my magazine, but it has had great success.
My hypothesis behind the metric were that teams that outgained their conference foes but finished with a losing record were much better than their record and would likely improve the next season. On the flip side, teams that were outgained but caught a lot of breaks and finished with a winning record would be overvalued and likely have a weaker record the next year.
I am a math guy and I had to come up with a formula to figure out how many yards translated into wins and or losses. Studying the many years of previous standings, I came up with 35 yards per game (ypg) per win above .500. My formula took the total ypg divided by the 35 ypg I credited for each game above .500 on the season and then added in half of the games played. As an example, a team that was 0 ypg on the year and played an eight-game schedule should have four wins on the year. {0/35= 0+4 (for half the games played)}. If a team played an eight-game schedule and went 8-0 they should be +140 ypg. If a team went 6-2, they should be +70 ypg. If a team played a nine-game schedule than +52.5 ypg would be the mark for a 6-3 season and a 9-0 season would be if a team was +158 ypg. It works the same for negative ypg which translates into losing record. In an eight-game schedule you would start with 4 wins (0 ypg) and then add in the negative number. If a team was -105 ypg and would be -3 or just 1 win for the season is what they should have achieved.
Let me give you some numbers from past years so you get an understanding of how this Metric works.
In 2023 Washington made it to the National Title game and was undefeated in Pac 12 play but were outgained during the regular season in conference play! That rated them a -4.65 on the YPG metric and they fell to 6-7 and a losing year! New Mexico St rated a -2.5 and went from 10-5 to 3-9! At the top of the chart in 2024 Illinois was 5-7 and just 3-6 in Big Ten play but outgained their Big Ten foes by 26 ypg rating a +2/25 and they went from 5-7 to doubling their wins a 10-3! In 2022 some teams that were at the top of the YPG chart in the Going up Box were USC, Arizona and South Alabama. USC was just 4-8 in 2021 but they were actually +38 ypg in conference play! They rated a +2.58 and went 11-3! Arizona was 1-11 in 2021 but were just -17 ypg and rated a +3.01 in the YPG metric. They improved to 5-7 in 2022. South Alabama was just 5-7 in 2021 but were +30 ypg in Conference play and rated a +2.85 and improved to 10-3 in 2022! In 2021 Michigan St was the star of this metric. Somehow, someway in 2021 they went 11-2 despite being -63 ypg in Big Ten play rating a -4.28 in this metric and they went just 5-7 in 2022!
In 2020 Tulsa was at the top of the Going Up Box for this metric. Tulsa was a poor 2-6 in conference play in 2019 but was only -5 ypg. Tulsa rated a +3.29 in my Conference YPG vs Wins. The next year in 2020 they were in the AAC title game vs Cincinnati. At the opposite end of the spectrum, Baylor was 8-1 in the Big 12 but only +23 ypg in 2019 which would be more indicative of a .500 year. The next year in 2020 Baylor went just 2-7.
In 2019 Florida Atlantic was at the top of the Going Up Box for this metric. FAU was +87 ypg in CUSA play in 2018 but just 3-5 in conference play. That had them at a +3.5 in my Conference YPG vs Wins metric. The next year in 2020, FAU went 7-1 in CUSA play and won the conference. At the bottom of the metric was Northwestern. The Wildcats were an AMAZING 8-1 in conference play in 2018, but were ACTUALLY -43 ypg in Big Ten Play! The next year Northwestern rated a -4.3 in this metric and while they had similar yards at -58 ypg their record ended up just 1-8 for a major step back.
In 2018 Baylor was near the top of the charts at +2.4 as they were 1-8 in Big 12 play in 2017 but only -40 ypg and in 2018 Baylor improved to 7-6 overall and 4-5 in conference play. Akron rated a -4.7 on my Conference YPG vs Wins metric as in 2017 they were 6-3 in MAC play but did it with mirrors as they were outgained by 103 ypg in conference play. As you would expect, the next year Akron tumbled to 2-6 in the MAC and 4-8 overall.
In 2017 Michigan St was at the top of the Going Up box as in 2016 the Spartans were +35 ypg in conference play but not only finished with a losing record but were 1-8!! My Conference YPG vs Wins metric at a +4.5 and as you would expect the Spartans were much better in 2017 as they were from 3-9 overall to 10-3 and 7-2 in Conference play. Georgia Tech was in the Going Down Box for 2017 as in 2016 the Yellow Jackets were 9-4 overall but were -86 ypg in Conference play. In 2017 Georgia Tech dropped to 5-6 overall.
In 2023 Florida State was near the top of the chart as they were #1 in the ACC with +165 ypg but only finished with a 5-3 conference record so they graded a +3.7 and they ran the table and had an unbeaten season. Iowa State was just 4-8 in 2022 but were +52 ypg in conference play so they rated a super +4.99 on the YPG chart! The Cyclones improved to 7-6. TCU was near the bottom of the chart with a grade of -2.38 and they went from playing in the national title game to a losing season at 5-7 .
Here is the chart for how this metric has done:
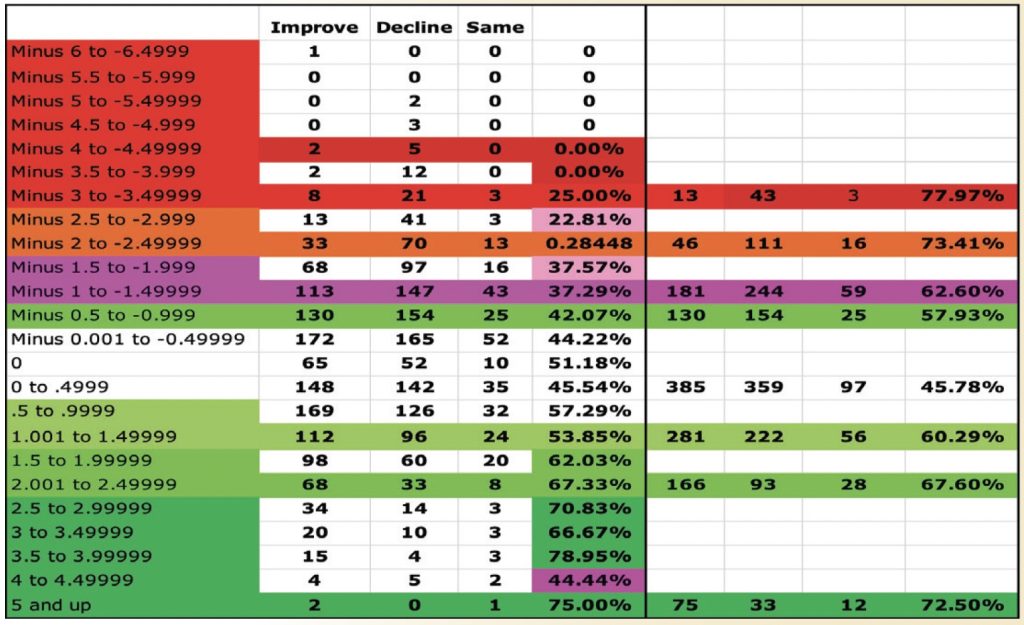
Since 2001 there have only been six teams rated at -4.5 or lower and of those 6 teams, five had a weaker record the next year. Now you know I think Bill Snyder was one of the greatest head coaches of all time. Somehow in 2011 his Kansas St Wildcats were -107 ypg yet, 6-2 in Big 12 play. That rated them a -6.051. The next year somehow Snyder had them 8-1 in the Big 12 including a win over Texas in the Big 12 title game to be the only team to buck the metric at that level. In 2024 there was a rare qualifier for that category in Washington which went 9-0 in the Pac 12 but were outgained during the regular season in conference play and rate a -4.65! Teams that are -2 or more have had a weaker or the same record 173 of 232 times for 74.1%. As you see on the chart the percentages work out perfectly with the records for teams in the negative category getting weaker as the negative points rise.
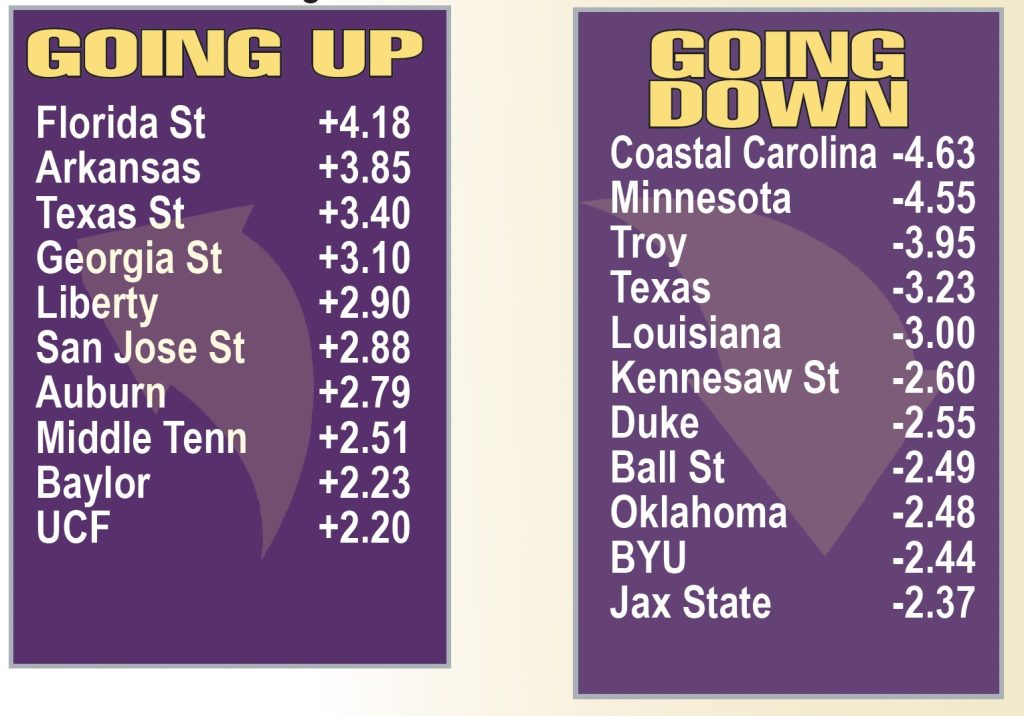
Last year I listed the Going Up Box and the Going Down Box on this page. The teams in the Going Up Box had a 5-2-2 record with 5 teams improving, two having weaker and 2 having the same record as the previous year. The Going down box had an even better record with 9 teams having a weaker record and 3 improving which was right at the 75% accuracy that these boxes normally have. Marshall went from 10-3 to 5-7 and Colorado St went from 8-5 to 2-10.
Here are the teams that make this year’s GOING UP BOX and GOING DOWN BOXES. These teams only have a 75% chance of improving their record if in the Going Up Box and having a weaker record if in the Going Down Box!
This years magazine is 376 pages and the biggest and best ever. Here are the different ways you can order the magazine.
Option #1 – Pick one up at your local Barnes and Noble or Books-a-Million store. When you go into a Barnes and Noble you get two different cover choices in each store! The official on sale date is July 4th but it is hitting some stores sooner. It is also available at Books-a-Million which all have the national cover. These two distributors are our exclusive vendors of the magazine, and they are not available at Walmart’s, Walgreens, Grocery Stores, other bookstores or drug stores so save your gas. The only two brick and mortar store they are available are Barnes and Noble and Books-A-Million.
Option #2 – Buy the Hard copy of the magazine at philsteele.com or call 1-866-918-7711. The total cost depends on where you live and which of the four types of shipping you choose. It will cost you in the ballpark of $10 for shipping and tax. The biggest advantage of buying online is that When you buy the Hard copy you GET the DIGITAL version of the magazine ($19.99) for FREE and it is updated thru September. Your digital access begins immediately when you purchase. You also get your choice of covers (National, SEC, Midwest, Southwest, West or East Coast) as these are generally mailed out the same or next business day as the order. Order Here!
Option #3 – Buy the digital magazine. The best thing about the digital magazine is that it is updated all the way thru the month of September. If a coach gets fired (that has happened the last couple of years) we update it. If a player is injured and out for the year we CIRCLE him in the magazine. If a player is added late (very rare) we put him in. Any changes to the team from the start of June thru the month of September is updated in the digital version. When you go to the philsteele.com store you will not see a picture there, you need to click on Digital Editions and order it there. It will be activated immediately giving you instant access. Order the Digital Here!
Option #4 – Order the VIP Bundle – The price of the VIP bundle is $44.95. With the VIP bundle you get the National Cover of the magazine. All VIP’s received EXCLUSIVE ACCESS to the digital version of the magazine for one week, but that bonus is gone as the digital is now available for everyone. You receive two magazines PLUS the Digital Magazine. You also receive FOUR Free issues of my Inside the Pressbox Newsletter ($20 per issue – $80 value) which gives you my Forecast and my computers forecast on EVERY FBS game each week. You also receive access to Phil Steele Plus ($25 per month) for the months of June, July, August and September! The VIP Bundle also includes SHIPPING so it is basically just $10 more than ordering the magazine by itself! Order the Reg VIP Bundle Here!!
Option #5 – THE BEST BUY – Order the Super VIP Bundle – The price of the SUPER VIP bundle is $74.95. With the Super VIP Bundle you receive
TWO magazines INCLUDING SHIPPING ($69 value!), EXCLUSIVE ACCESS to the digital version for one week (that happened already), order shipped next business day. Use the 2nd magazine when your first one gets dogeared or sell/give it to a friend.
Digital magazine ($19.95 value) FREE – The digital magazine is updated thru September (see option 3) and you get immediate access to the digital version upon purchase.
Four Issues of my Inside the Pressbox newsletter ($80 value) which gives you my forecast and my COMPUTERs forecast on EVERY FBS games each week (including FBS vs FCS) the same bonuses that the VIP’s get. You also receive…
FCS Digital Magazine ($25) FREE – Two full pages on Every FCS team laid out the same way the pages are for the FBS magazine. There are 128 FCS teams so over 250 pages!
NFL Digital Magazine ($15) FREE – Four full pages on Every NFL team and a Fantasy Football section!
Phil Steele Plus ($99 value) ENTIRE SEASON FREE – This is a tremendous addition. If you purchase the full year access to Phil Steele Plus it is $99 but you get it included in the Super VIP Bundle Purchase the Super VIP Bundle now and get the entire year of Phil Steele Plus FREE!! Here is a link to all the great info available on Phil Steele Plus including the schedule predictor! Order the Super VIP Bundle Here!!
