Every year I am adding to new features and articles to my College Football Preview and PhilSteele.com and for all 130 teams I have added a couple extra columns to the Game-by-Game Stats that you will find for every team. A lot of people have been asking me what those columns stand for and I thought I would explain it further in today’s blog.
Sample below of Ohio St’s Game by Game Stats as a subscriber to Phil Steele Plus on Philsteele.com.
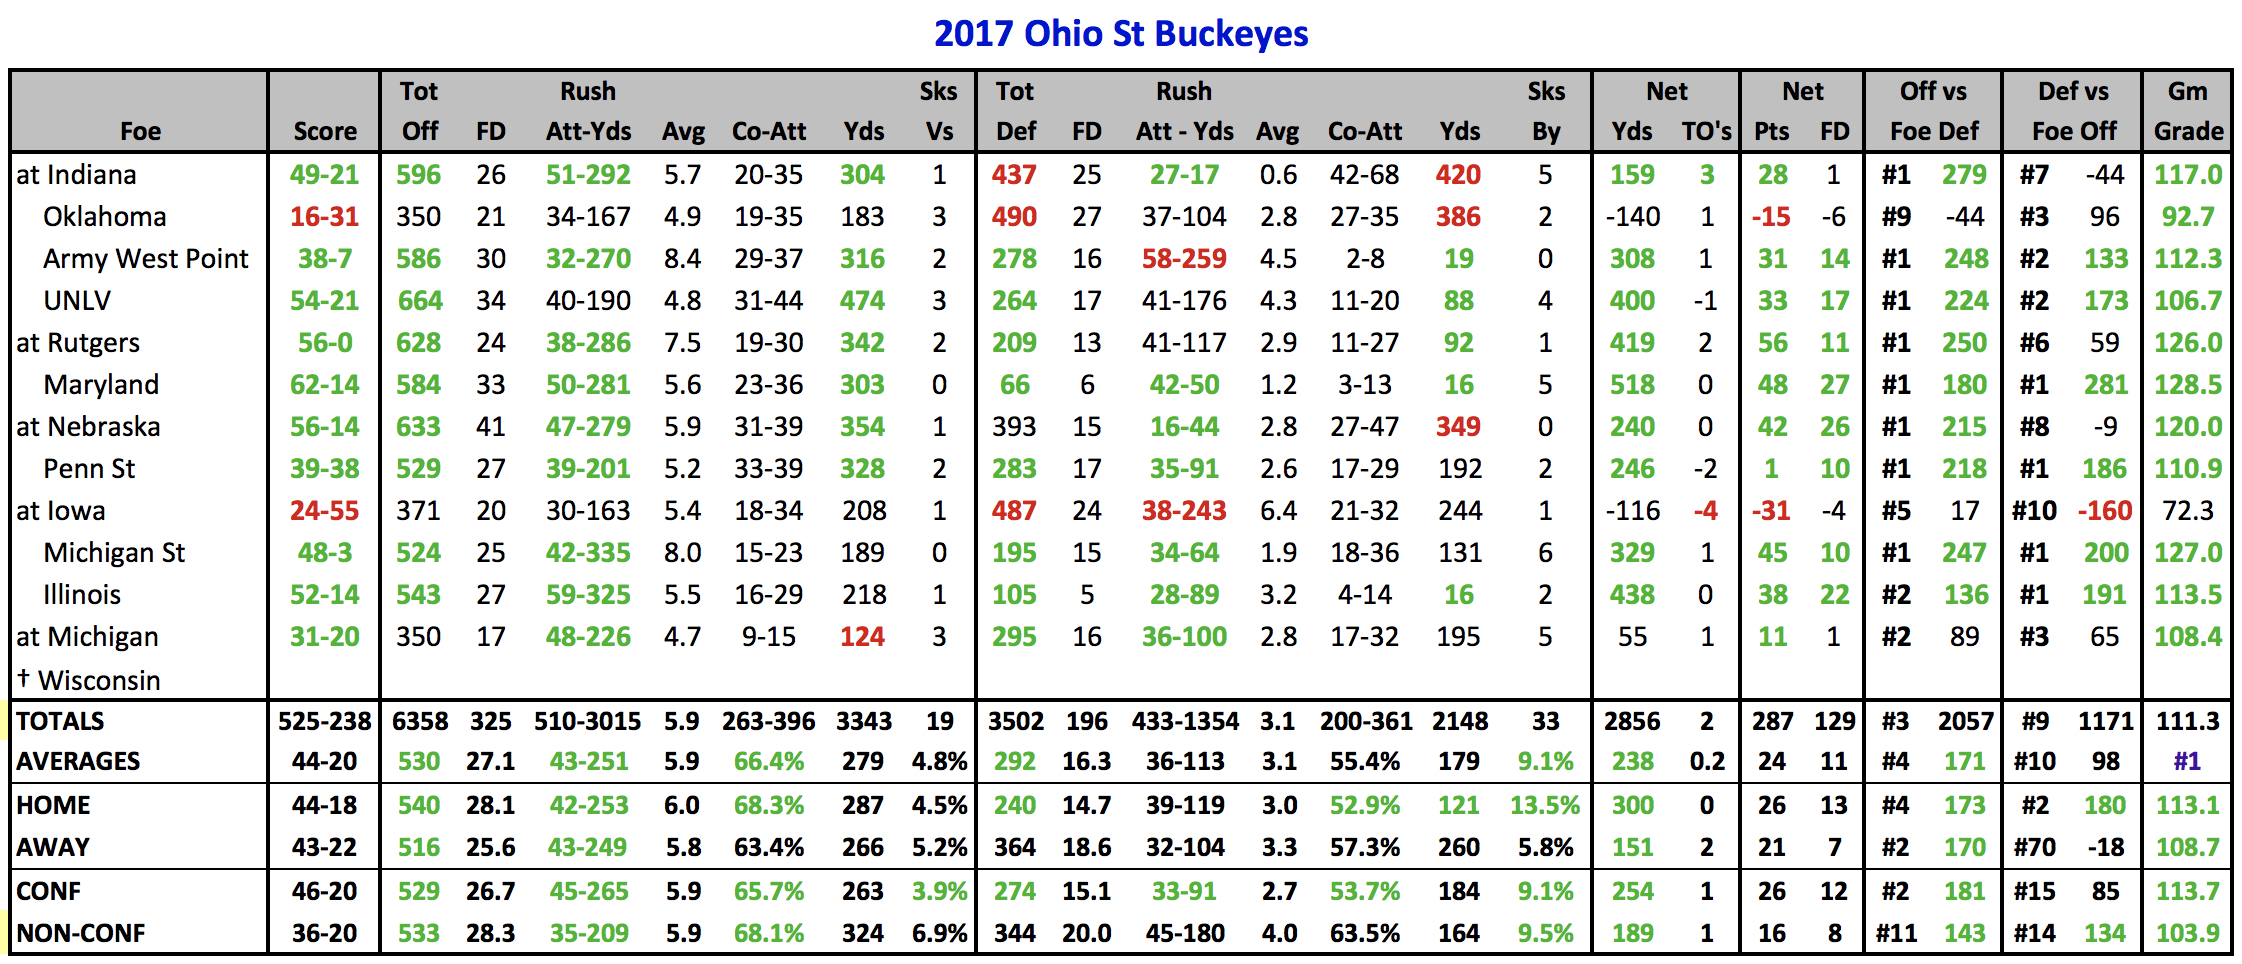
I have broke down the offensive and defensive averages and in today’s blog I took all those averages (both offense and defense) and combined them to come up with the most impressive teams in the country compared to how they fared against their opponent. Here is a ranking of all 130 teams and how they did. This list does take out Garbage yards that may occur during overtime and/or blowout wins/losses. You you may see a difference in rankings from the Game by Game Stats listed on the actual Teams Pages. The team page game by game stats include garbage yards.
Here is the breakdown of Offensive and Defensive YPG vs Opponents Average through week 13.
| Offensive | Defensive | |||||
| Team | Rank | Average | Rank | Average | Total | Rank |
| OHIO ST | 3 | 171.5 | 12 | 99.0 | 270.4 | 1 |
| ALABAMA | 7 | 100.0 | 1 | 143.6 | 243.7 | 2 |
| OKLAHOMA | 1 | 204.8 | 43 | 29.4 | 234.2 | 3 |
| AUBURN | 6 | 103.6 | 5 | 128.6 | 232.2 | 4 |
| CLEMSON | 24 | 68.4 | 3 | 132.2 | 200.6 | 5 |
| GEORGIA | 25 | 68.3 | 4 | 131.3 | 199.6 | 6 |
| WISCONSIN | 29 | 56.0 | 2 | 140.0 | 196.0 | 7 |
| OKLAHOMA ST | 4 | 170.9 | 57 | 17.7 | 188.6 | 8 |
| PENN ST | 10 | 96.7 | 26 | 50.0 | 146.7 | 9 |
| LOUISVILLE | 2 | 174.8 | 93 | -28.7 | 146.1 | 10 |
| NOTRE DAME | 18 | 82.5 | 24 | 53.0 | 135.5 | 11 |
| WASH ST | 40 | 34.3 | 10 | 101.1 | 135.4 | 12 |
| LSU | 34 | 43.7 | 13 | 91.6 | 135.3 | 13 |
| MISS ST | 30 | 46.7 | 16 | 83.3 | 130.0 | 14 |
| MICHIGAN | 65 | 2.6 | 6 | 123.3 | 125.9 | 15 |
| UCF | 11 | 95.9 | 49 | 23.5 | 119.4 | 16 |
| SOUTH FLORIDA | 21 | 73.4 | 32 | 45.0 | 118.4 | 17 |
| WASHINGTON | 66 | 1.1 | 7 | 117.0 | 118.1 | 18 |
| MICHIGAN ST | 55 | 11.8 | 11 | 100.6 | 112.4 | 19 |
| VIRGINIA TECH | 51 | 19.6 | 14 | 91.6 | 111.2 | 20 |
| NC State | 23 | 68.7 | 37 | 34.2 | 102.9 | 21 |
| BOISE ST | 42 | 32.7 | 20 | 66.7 | 99.5 | 22 |
| USC | 17 | 83.4 | 59 | 15.1 | 98.5 | 23 |
| TCU | 83 | -16.9 | 8 | 113.6 | 96.8 | 24 |
| TOLEDO | 8 | 97.3 | 66 | -0.8 | 96.6 | 25 |
| SAN DIEGO ST | 73 | -8.8 | 9 | 104.2 | 95.4 | 26 |
| MIAMI FLA | 36 | 42.2 | 35 | 41.0 | 83.2 | 27 |
| OREGON | 41 | 33.9 | 27 | 48.9 | 82.8 | 28 |
| UTAH | 63 | 3.8 | 21 | 63.1 | 66.9 | 29 |
| GEORGIA TECH | 37 | 35.8 | 44 | 29.0 | 64.8 | 30 |
| INDIANA | 31 | 46.4 | 58 | 16.9 | 63.3 | 31 |
| NAVY | 56 | 10.9 | 28 | 48.5 | 59.4 | 32 |
| FLORIDA ATLANTIC | 9 | 96.8 | 100 | -39.6 | 57.2 | 33 |
| TROY ST | 54 | 16.4 | 36 | 40.0 | 56.4 | 34 |
| TEXAS | 91 | -23.8 | 17 | 79.6 | 55.8 | 35 |
| MEMPHIS | 27 | 66.3 | 77 | -10.9 | 55.4 | 36 |
| MISSOURI | 5 | 105.8 | 112 | -51.1 | 54.7 | 37 |
| S MISS | 46 | 26.1 | 46 | 26.7 | 52.8 | 38 |
| UTSA | 93 | -26.5 | 18 | 78.6 | 52.2 | 39 |
| PURDUE | 43 | 30.9 | 54 | 19.2 | 50.1 | 40 |
| WAKE FOREST | 14 | 87.8 | 101 | -39.9 | 47.9 | 41 |
| WEST VIRGINIA | 19 | 80.1 | 96 | -33.6 | 46.5 | 42 |
| IOWA ST | 90 | -23.6 | 19 | 69.6 | 46.0 | 43 |
| TEXAS TECH | 32 | 45.6 | 71 | -4.1 | 41.5 | 44 |
| BOSTON COLL | 58 | 10.1 | 41 | 30.4 | 40.5 | 45 |
| FRESNO ST | 79 | -15.4 | 22 | 54.6 | 39.2 | 46 |
| NORTHWESTERN | 52 | 19.3 | 56 | 17.9 | 37.2 | 47 |
| ARKANSAS ST | 35 | 43.2 | 73 | -6.2 | 37.0 | 48 |
| STANFORD | 62 | 6.0 | 40 | 30.8 | 36.8 | 49 |
| COLORADO ST | 12 | 90.3 | 116 | -54.7 | 35.5 | 50 |
| FLORIDA ST | 109 | -54.8 | 15 | 89.3 | 34.5 | 51 |
| SYRACUSE | 15 | 85.6 | 115 | -53.3 | 32.4 | 52 |
| MARSHALL | 81 | -15.7 | 31 | 45.7 | 29.9 | 53 |
| IOWA | 78 | -13.8 | 33 | 43.2 | 29.5 | 54 |
| TEXAS A&M | 59 | 9.7 | 53 | 19.7 | 29.5 | 55 |
| ARMY | 67 | -4.7 | 38 | 33.4 | 28.7 | 56 |
| DUKE | 82 | -16.1 | 34 | 42.9 | 26.8 | 57 |
| N ILLINOIS | 95 | -27.7 | 23 | 54.0 | 26.3 | 58 |
| OHIO U | 45 | 26.9 | 69 | -1.5 | 25.4 | 59 |
| ARIZONA | 26 | 68.2 | 107 | -44.4 | 23.9 | 60 |
| Appalachian St | 75 | -9.2 | 39 | 32.7 | 23.5 | 61 |
| VIRGINIA | 92 | -25.1 | 29 | 48.3 | 23.2 | 62 |
| LOUISIANA TECH | 39 | 34.6 | 80 | -12.6 | 22.1 | 63 |
| NEW MEXICO ST | 33 | 45.5 | 87 | -24.9 | 20.6 | 64 |
| NORTH TEXAS | 22 | 69.1 | 111 | -49.7 | 19.4 | 65 |
| HOUSTON | 76 | -10.8 | 42 | 29.8 | 19.0 | 66 |
| UMass | 47 | 25.6 | 75 | -9.4 | 16.3 | 67 |
| PITTSBURGH | 72 | -8.4 | 48 | 24.7 | 16.3 | 68 |
| ARIZONA ST | 44 | 30.0 | 81 | -14.1 | 15.9 | 69 |
| E MICHIGAN | 80 | -15.4 | 52 | 20.1 | 4.7 | 70 |
| TEMPLE | 104 | -43.4 | 30 | 47.7 | 4.3 | 71 |
| UCLA | 28 | 64.2 | 117 | -60.3 | 3.9 | 72 |
| MIDDLE TENN | 84 | -17.1 | 55 | 19.0 | 1.9 | 73 |
| MISSISSIPPI | 16 | 84.3 | 125 | -82.7 | 1.6 | 74 |
| SMU | 20 | 73.8 | 121 | -72.3 | 1.5 | 75 |
| FLORIDA | 96 | -28.2 | 45 | 28.1 | -0.1 | 76 |
| C MICHIGAN | 77 | -12.6 | 61 | 11.1 | -1.6 | 77 |
| BAYLOR | 61 | 7.5 | 74 | -9.2 | -1.6 | 78 |
| BUFFALO | 48 | 24.9 | 94 | -30.1 | -5.2 | 79 |
| AIR FORCE | 53 | 19.0 | 89 | -26.2 | -7.3 | 80 |
| MIAMI (OH) | 74 | -8.9 | 65 | -0.1 | -9.0 | 81 |
| NEBRASKA | 38 | 35.0 | 106 | -44.2 | -9.2 | 82 |
| CALIFORNIA | 99 | -34.7 | 50 | 20.7 | -14.1 | 83 |
| W MICHIGAN | 86 | -20.8 | 72 | -4.7 | -25.6 | 84 |
| W KENTUCKY | 68 | -5.1 | 85 | -23.3 | -28.4 | 85 |
| ARKANSAS | 60 | 9.0 | 99 | -37.6 | -28.6 | 86 |
| Georgia St | 85 | -17.5 | 79 | -12.5 | -30.0 | 87 |
| MINNESOTA | 114 | -61.9 | 47 | 26.1 | -35.9 | 88 |
| S CAROLINA | 106 | -47.1 | 62 | 7.9 | -39.2 | 89 |
| UTAH ST | 89 | -23.1 | 83 | -20.3 | -43.4 | 90 |
| ULM | 13 | 90.1 | 130 | -136.3 | -46.2 | 91 |
| NEW MEXICO | 105 | -45.0 | 67 | -1.2 | -46.2 | 92 |
| UAB | 100 | -36.1 | 76 | -10.5 | -46.5 | 93 |
| BYU | 116 | -67.3 | 51 | 20.4 | -46.9 | 94 |
| FLORIDA INT’L | 87 | -21.1 | 92 | -28.6 | -49.7 | 95 |
| COLORADO | 71 | -8.2 | 102 | -41.8 | -50.0 | 96 |
| Georgia Southern | 103 | -42.3 | 78 | -11.5 | -53.8 | 97 |
| UNLV | 49 | 21.7 | 123 | -76.2 | -54.4 | 98 |
| NEVADA | 57 | 10.5 | 118 | -65.1 | -54.5 | 99 |
| KENTUCKY | 98 | -29.3 | 88 | -26.1 | -55.4 | 100 |
| TULANE | 108 | -53.4 | 70 | -2.1 | -55.5 | 101 |
| MARYLAND | 97 | -28.5 | 90 | -27.4 | -55.9 | 102 |
| KANSAS ST | 115 | -66.6 | 64 | 3.3 | -63.3 | 103 |
| CINCINNATI | 107 | -52.2 | 82 | -14.5 | -66.7 | 104 |
| IDAHO | 121 | -81.7 | 60 | 14.1 | -67.6 | 105 |
| N CAROLINA | 94 | -27.6 | 104 | -42.5 | -70.1 | 106 |
| VANDERBILT | 102 | -37.9 | 98 | -34.9 | -72.8 | 107 |
| HAWAII | 70 | -7.7 | 119 | -66.0 | -73.8 | 108 |
| WYOMING | 129 | -135.3 | 25 | 52.3 | -82.9 | 109 |
| TULSA | 69 | -5.8 | 124 | -82.3 | -88.1 | 110 |
| EAST CAROLINA | 50 | 20.9 | 127 | -109.7 | -88.8 | 111 |
| Coastal Carolina | 117 | -68.1 | 91 | -28.1 | -96.2 | 112 |
| SOUTH ALABAMA | 126 | -102.3 | 68 | -1.5 | -103.8 | 113 |
| RICE | 112 | -58.4 | 109 | -46.1 | -104.5 | 114 |
| TENNESSEE | 119 | -81.2 | 86 | -23.5 | -104.7 | 115 |
| BALL STATE | 113 | -60.3 | 108 | -45.5 | -105.9 | 116 |
| Texas St | 110 | -56.0 | 114 | -52.8 | -108.8 | 117 |
| CONNECTICUT | 88 | -21.4 | 126 | -88.2 | -109.6 | 118 |
| Old Dominion | 111 | -58.0 | 113 | -52.6 | -110.6 | 119 |
| LOUISIANNA | 101 | -36.8 | 122 | -75.3 | -112.1 | 120 |
| OREGON ST | 118 | -69.5 | 105 | -43.1 | -112.6 | 121 |
| ILLINOIS | 122 | -82.5 | 95 | -30.3 | -112.9 | 122 |
| KENT ST | 128 | -124.7 | 63 | 4.5 | -120.3 | 123 |
| BOWLING GREEN | 64 | 3.8 | 128 | -124.4 | -120.6 | 124 |
| AKRON | 120 | -81.3 | 110 | -47.6 | -128.9 | 125 |
| KANSAS | 124 | -94.4 | 103 | -42.5 | -136.8 | 126 |
| RUTGERS | 127 | -113.0 | 97 | -34.5 | -147.5 | 127 |
| Charlotte | 125 | -98.3 | 120 | -70.8 | -169.0 | 128 |
| UTEP | 130 | -160.3 | 84 | -20.5 | -180.8 | 129 |
| SAN JOSE ST | 123 | -85.9 | 129 | -126.9 | -212.7 | 130 |