Tweet
For more than 9 years I have published an “Experience Chart” in my National College Football Preview. The old version of this chart just took into account the overall experience from the 2 deep for each squad. Several years ago I revised the Experience Chart and created a New and Improved version. The updated chart uses 20% of the experience grade from the old chart, 20% from the % of lettermen returning, 20% from the percent of tackles returning, 20% from the percent of yards returning and 20% from the career starts of the offensive line.
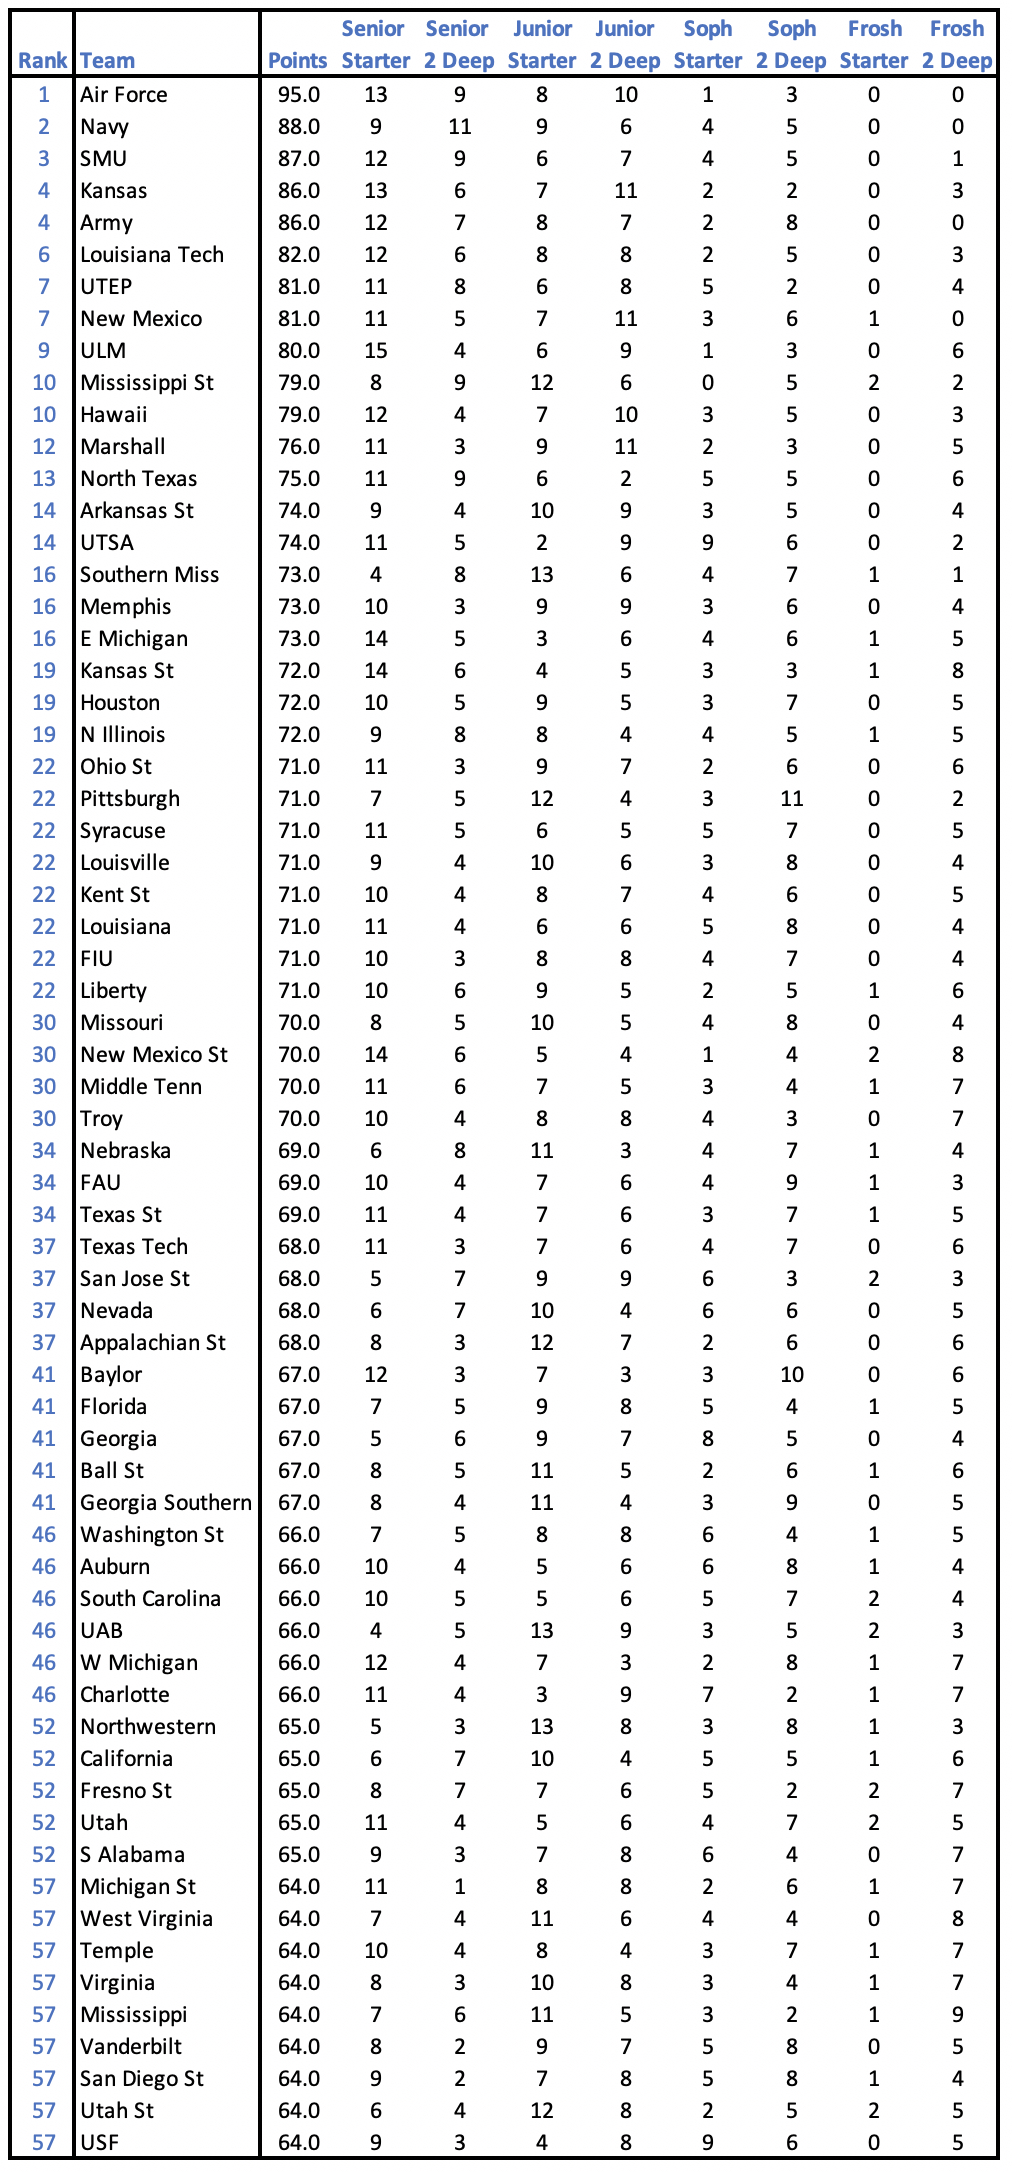
The most experienced teams when using the old chart were usually the service academies, which play a lot of seniors and juniors. Using the old method (which is listed below) the top 5 most experienced teams in terms of upperclassmen in the two deep are: 1. Air Force, 2. Navy, 3. SMU, 4. Kansas, 5. Army west Point.
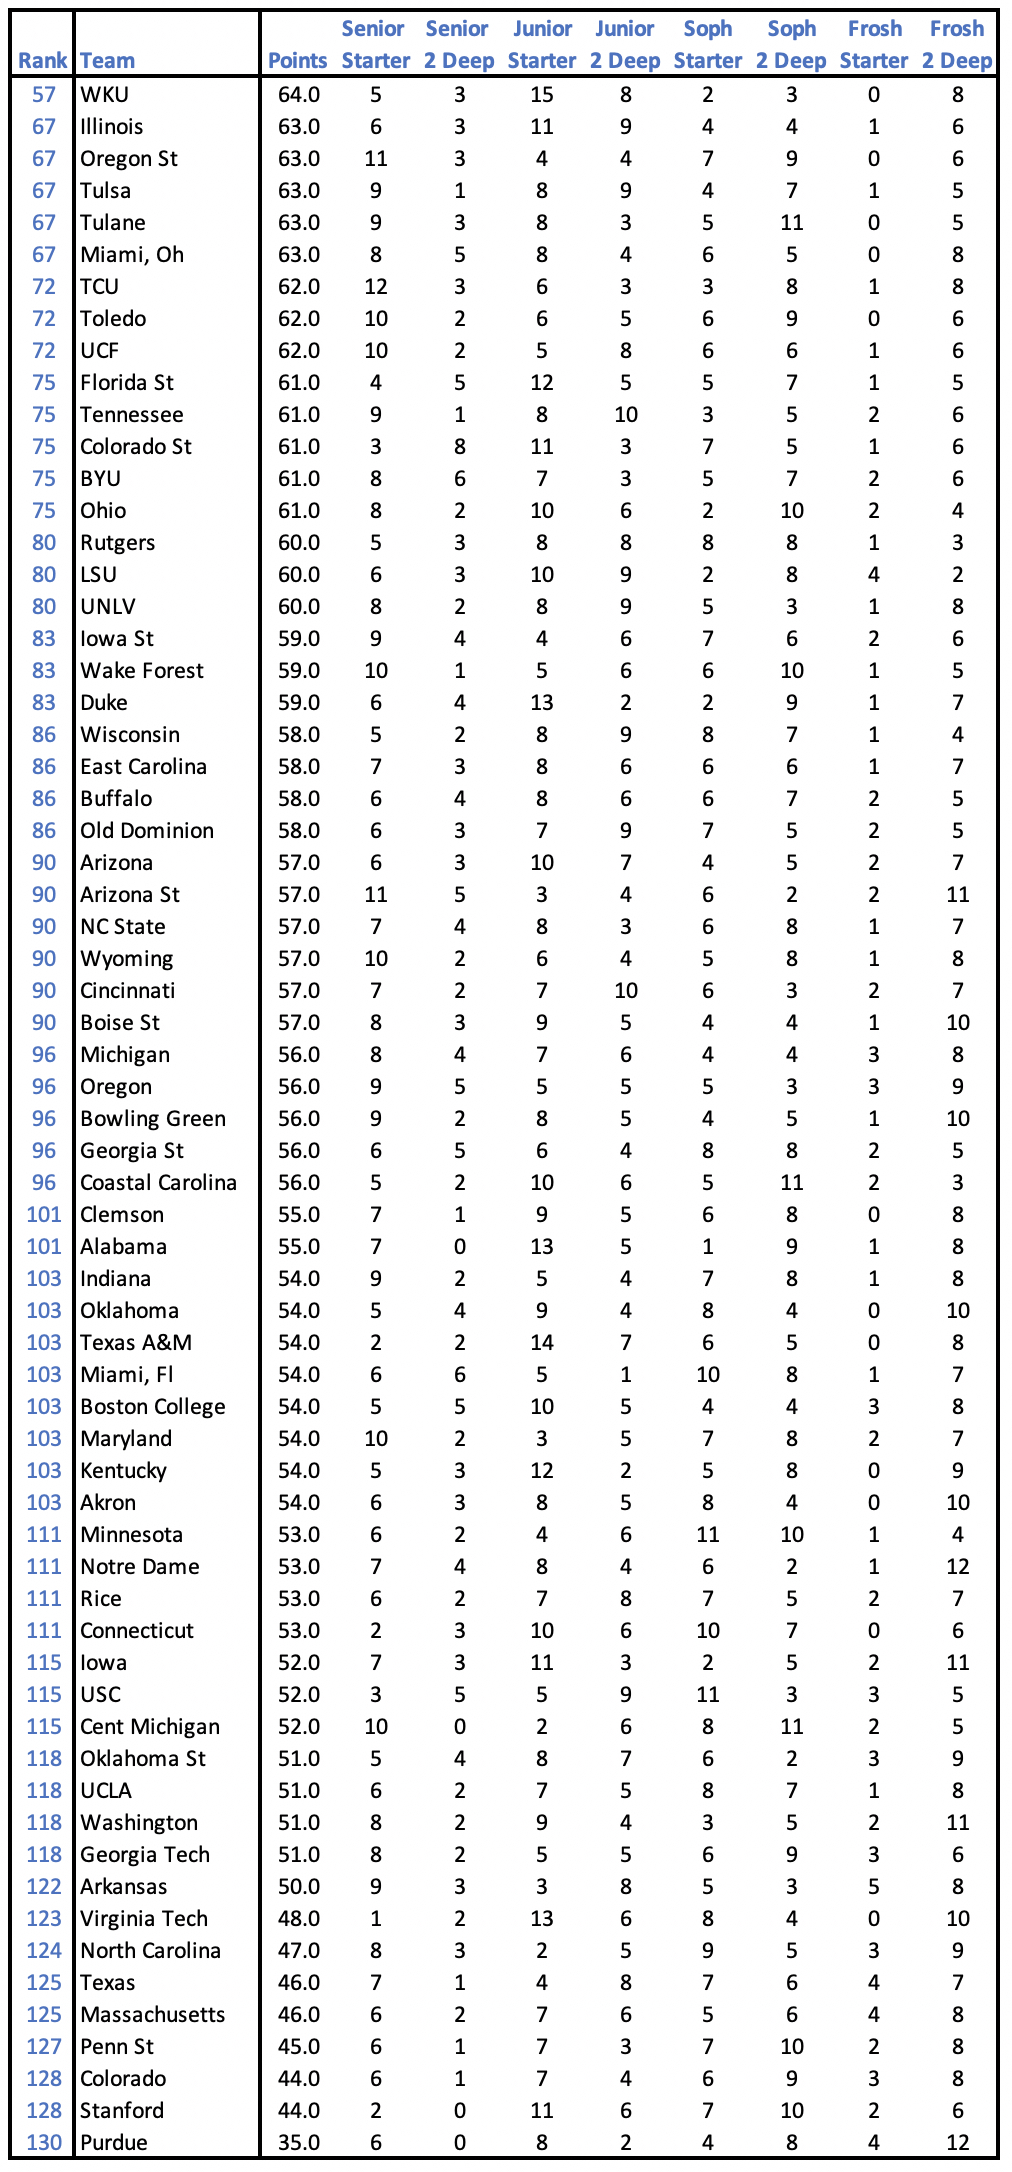
The least experienced teams using this method are: 130. Purdue, 128. Stanford, 128. Colorado, 127. Penn St, 125. Massachusetts.
Experience can be a big thing in college football. A player gains valuable experience for every year he plays and becomes a better player because of it. Players also mature physically while they are in college and there is a big difference between a raw 17 or 18-year old true freshman and a mature and physically stronger 22-year old senior. Some teams that send their players away on missions, like BYU, routinely have Seniors up to 25 years old. There is also a coaching adage that for every freshman starter you have, you lose one game. With that in mind, we compiled the following chart. It lists the total amount of senior starters on the team as well as seniors in the two deep. It also shows all of the juniors, sophomores and freshmen starters and the total amount in the two deep.
To formulate a point system, I awarded 3 points for every senior starter (2.5 for every additional senior in the two deep) 2 points for every junior starter (1.5 for every additional junior in the two deep) 1 point for a sophomore starter (0.5 for every additional soph in the two deep) then subtracted 1 point for every frosh starter and .5 for every frosh in the two deep. The total points column uses that formula to figure out the points awarded to a team. The number before the team is where they came up in my overall ranking of all the teams in the NCAA. This list was compiled during magazine season and there have been some changes to the two deep since it went to press, which may not be accounted for. This chart will give you an idea of the most experienced and least experienced teams in the NCAA this year.
On Wednesday we post the entire updated Experience Chart from the 2019 Magazine PG 29.


Want a Digital Copy of the Phil Steele’s 2019 College Football Preview?
Here are all the Links Needed for the 2019 Phil Steele Digital Magazine.
**Remember if you purchase the magazine on one of these platforms your login credentials can be used on the Webstand, Google Play, Apple App Store and Amazon Kindle versions.
Having problems Registering your new account? Click here for tutorial or having login issues email us for help Here
2019 College Football Preview for $12.99 (Available now on the Webstand, Google Play & Apple App Store)

Webstand (Browser Version): * Click Here (2019 Available Now)
Google Play Store: * Click Here (2019 Available Now)
Apple App Store: * Click Here (2019 Available Now)
Amazon Kindle: * Click Here (2019 Available Now)
