Metrics, Metrics, Metrics. In 2012 I produced my first Stock Market Indicator article and it has delivered solid results each year. In 2012, Ohio St had a Stock Market Indicator (SMI) of +5.5, which would be a Bull Market. The +5.5 was calculated by taking their average win total from 2009-2010, which was 11.5 (11-2 in ’09, 12-1 in ’10), then subtracting their wins from ‘11 (just 6) which produced the +5.5. The Buckeyes clearly underperformed in ‘11 and were poised for a big bounce back the next year (Bull Market). My Stock Market Indicator proved to be spot on as the Buckeyes were the Most Improved Team in the country going 12-0 in ’12! In ‘13, Auburn was coming off a 3-9 season following two years of a combined 22-5. That earned them a +8 in my Stock Market Indicator and they got to the National Title game! In 2014, TCU was +5 in the Bull Market and went from 4-8 to 12-1 as the Most Improved Team in the country! In 2016, UCF was an amazing +10.5 in the Bull Market and improved from 0-12 to earning a bowl bid. The last two years 20 teams have made the Bull Market box and 16 have improved their record!
The Bear Market has also been a very accurate indicator. Of the 8 teams that made the 2016 article, only 1 managed to improve their record with 6 of the 8 having weaker records. Last year 9 teams were in the Bear Market box including Colorado, Idaho, Tulsa, Eastern Michigan and Western Michigan who all missed out on a bowl after getting to one in 2016. Here is a breakdown of the records and this years qualifiers.
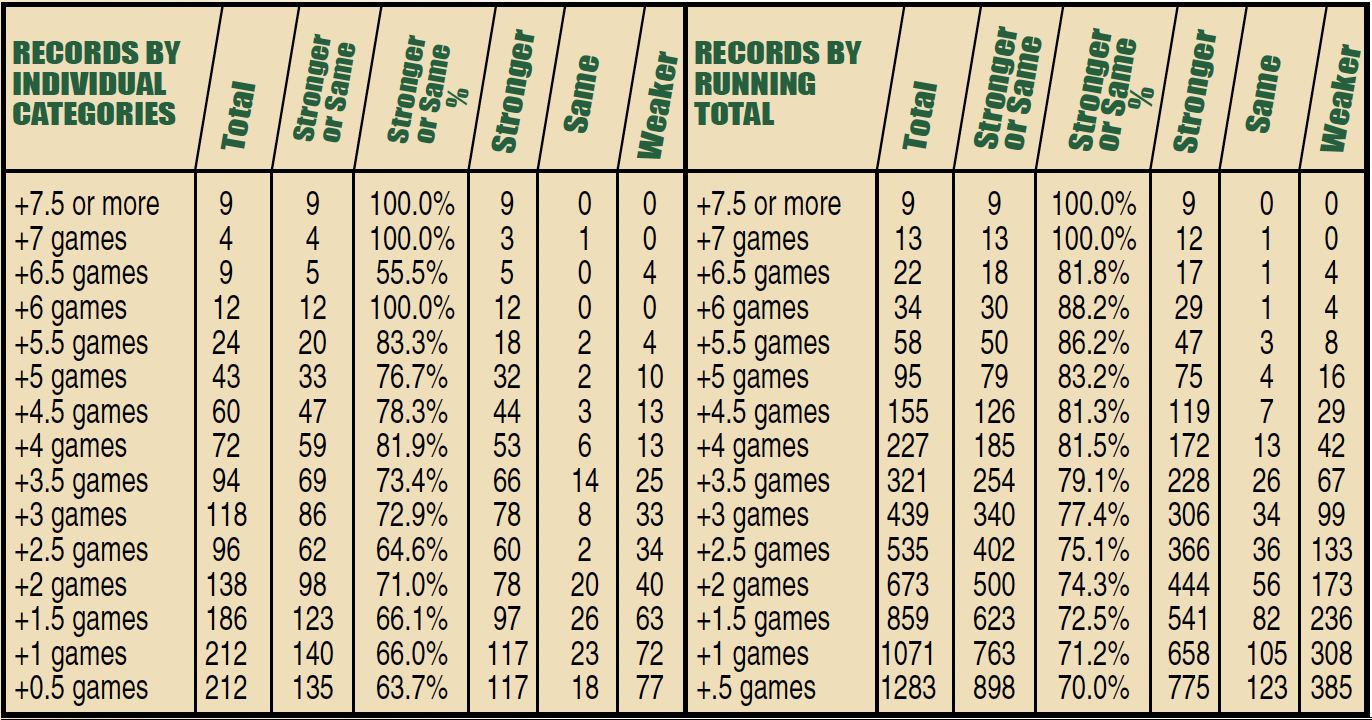
THE BULL MARKET: After several years I expanded my research to take a look back at all records since 1990 and the numbers were proven to be solid for decades. Since 1990, there have been a total of 34 teams that had a +6 Stock Market Indicator meaning that the prior year’s win total was 6 wins less than the average of the 2 years prior. Of those 34 teams, only 4 teams had a weaker record, while 29 improved, and 1 stayed the same. That improvement was dramatic going from a combined 93-311 (23.0%) to 183-230 (44.3%). Teams in the +5.5 category have improved their record 18 times, had a weaker record just 4 times, and the same record twice. There have been 48 instances of teams being +5 in the SMI category and those teams were 36-10-2 (79.1%). The records for +4.5 are now 46-13-3 (79.0%) and despite going down to +4 in my Stock Market Indicator, it surprisingly jumped back up to 54-13-7 (82.4%), which are superior to the individual +4.5 and +5 range. The numbers do drop back to 72.9% for a +3.5 net wins, 72.0% for +3, and down to 65.0% for +2.5. However, just when you thought the trend would get lower, surprisingly +2.0 has a 73.2% success rate. Even teams that had a +1.5 SMI from the prior two years went up or stayed the same 66.0% of the time and teams that were either +1 & +0.5 combined for 65.5%!
Summing it all up, I will put it into 4 categories. Teams with a +6.0 SMI or higher are an almost perfect 29-4-1 (88.2%). Teams in the +4 to +5.5 range are 154-40-14 (80.8%) while teams in the +2 to +3.5 two-year SMI range are 289-136-45 (71.1%). Teams that were in the +.5 to +1.5 range are 342-217-70 (60.6%). Overall, of the 1,341 teams s/’90 that had a +.5 SMI or higher, 814 improved their record, and 130 had the same record meaning 70.4% of the time, teams in that category improved or had the same record.
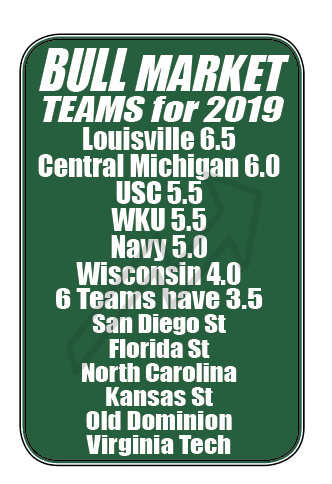
This year only 2 teams fall into the top bracket of +6 or more on the two-year SMI. Also listed are teams with a +3.5 or more on my SMI.
This year 2 teams fall into the top bracket of +6 or more on the two-year SMI. Also listed are teams with a +3.5 or more on my SMI.
THE BEAR MARKET: Like all of my systems I put in my magazine, there is a two-way street to this Stock Market Indicator (SMI). I also have reviewed the numbers since 1990 on the Bear side of the market, analyzing teams with a negative indicator, indicating that a team had likely over achieved the prior season, and the numbers were similar to the Bull side. In fact, of 47 teams that had a -6.0 SMI or lower since 1990, only 5 managed to improve their record. North Texas was one of those rare exceptions last year going from 9-5 to 9-4. The biggest drop-offs came in 1998. Tulane had a -7.5 SMI and went from 12-0 to 3-8. Interestingly in 1998 I called for Washington St to go from the Rose Bowl to last place in the Pac-10, which they did and in the 2 year SMI they were -6.0 and went from 10-2 to just 3-8. In 2017, Tulsa was -6.0 and went from 10-3 to 2-10. Last year Florida Atlantic went from 11-3 to 5-7.
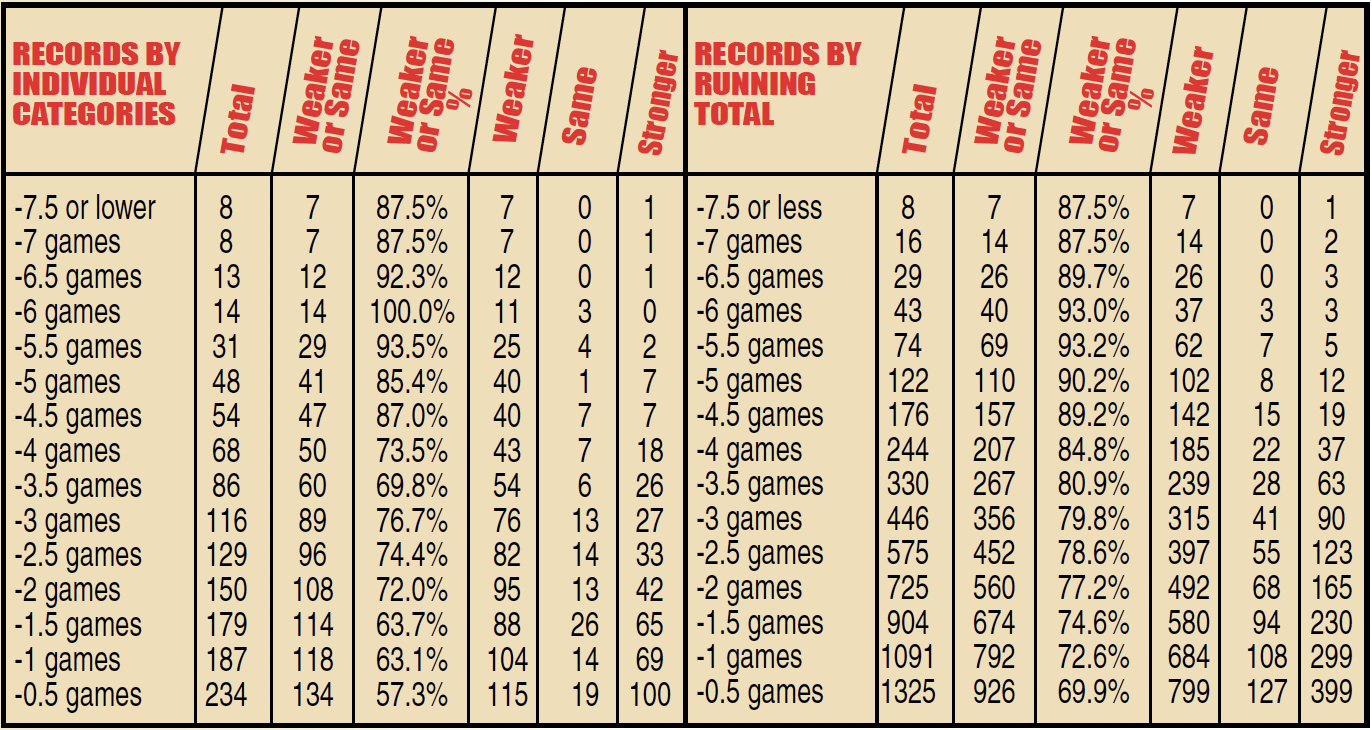
A look at the numbers shows a powerful trend of basically 76.8% if teams have a -2.0 SMI or less since 1990, they have had a weaker or the same record the next year. Unlike the above positive Market Indicator, there were actually two teams that bucked the trend with a -7.5 or -7 & improved, but overall the chart has higher percentages at the -6 and below level (39-5-3 89.4%). Teams that had a Stock Market Indicator of -5 or lower had a weaker or the same record the next year 88.3% of the time with 104 having a weaker record, only 15 with a stronger record, and 9 having the same record. Even teams with SMI between -3.0 to -4.5 were in a 75.9% category. The teams in the -2.0 to -2.5 Stock Market Indicator had a weaker or same record the next year 75.8% of the time. Teams in the -1 to -1.5 range had the same or weaker record only 63.6% of the time.
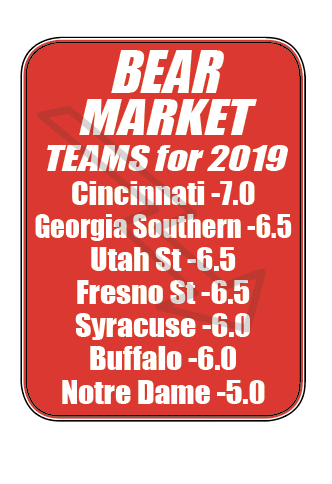
Overall, teams that had a -2 SMI or lower had the weaker or same record basically 76.8% of the time. The last three years 18 teams rated a -5 or higher (in the box of this article), and only 8 of them improved their record. Here are the 7 teams with a -5.0 SMI or lower including 5 at -5.5 or higher.
The last three years 25 Teams rated a -5 or higher (in the box of this article), and only 8 improved their record. Here are the 7 teams with a -5.0 SMI or lower including 5 at -5.5 or higher.
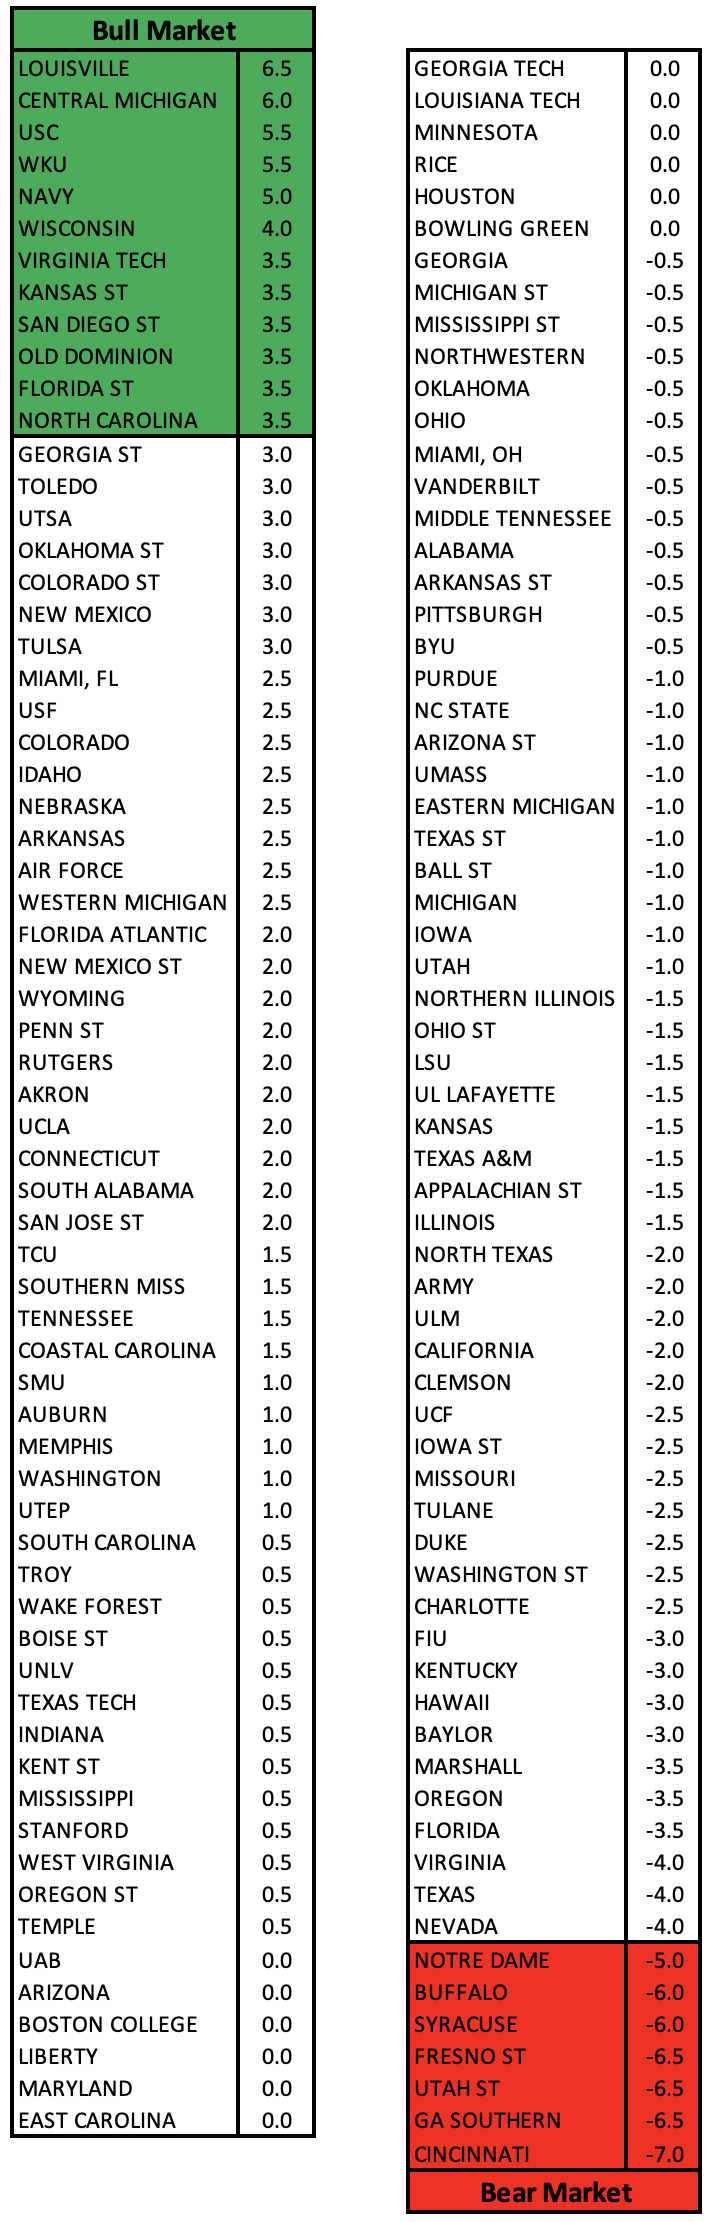
 Here is the complete list of the Stock Market Indicator. Teams highlighted in green are the Bull Market. Teams highlighted in red are the Bear Market.
Want a Digital Copy of the Phil Steele’s 2019 College Football Preview?
Here are all the Links Needed for the 2019 Phil Steele Digital Magazine.
**Remember if you purchase the magazine on one of these platforms your login credentials can be used on the Webstand, Google Play, Apple App Store and Amazon Kindle versions.
Having problems Registering your new account? Click here for tutorial or having login issues email us for help Here
2019 College Football Preview for $12.99 (Available now on the Webstand, Google Play & Apple App Store)
Webstand (Browser Version): * Click Here (2019 Available Now)
Google Play Store: * Click Here (2019 Available Now)
Apple App Store: * Click Here (2019 Available Now)
Amazon Kindle: * Click Here (2019 Available Now)