Metrics, Metrics, Metrics. In 2012 I produced my first Stock Market Indicator article and it has delivered solid results each year.
In 2012 Ohio St had a Stock Market Indicator (SMI) of +5.5, which would be a Bull Market. The +5.5 was calculated by taking their average win total from 2009-2010, which was 11.5 (11-2 in ’09, 12-1 in ’10) and then subtracting their wins from ‘11 (just 6) which produced the +5.5. The Buckeyes clearly underperformed in ‘11 and were poised for a big bounce back the next year (Bull Market). My Stock Market Indicator proved to be spot on as the Buckeyes were the Most Improved Team in the country going 12-0 in ’12! In ‘13 Auburn was coming off a 3-9 season following two years of a combined 22-5. That earned them a +8 in my Stock Market Indicator and they got to the National Title game! In 2014 TCU was +5 in the Bull Market and went from 4-8 to 12-1 and was the Most Improved Team in the country! In 2016 UCF was an amazing +10.5 in the Bull Market and improved from 0-12 to earning a bowl bid. Last year 7 of the 9 teams that made the Bull Market box in ‘17 went from a losing record to a bowl!
The Bear Market has also been a very accurate indicator. Of the 8 teams that made 2016’s article, only 1 managed to improve their record with 6 of the 8 having weaker records. Last year 9 teams were in the Bear Market box including Colorado, Idaho, Tulsa, Eastern Michigan, Western Michigan who all missed out on a bowl after getting to one in 2016. Here is a breakdown of the records and this years qualifiers.
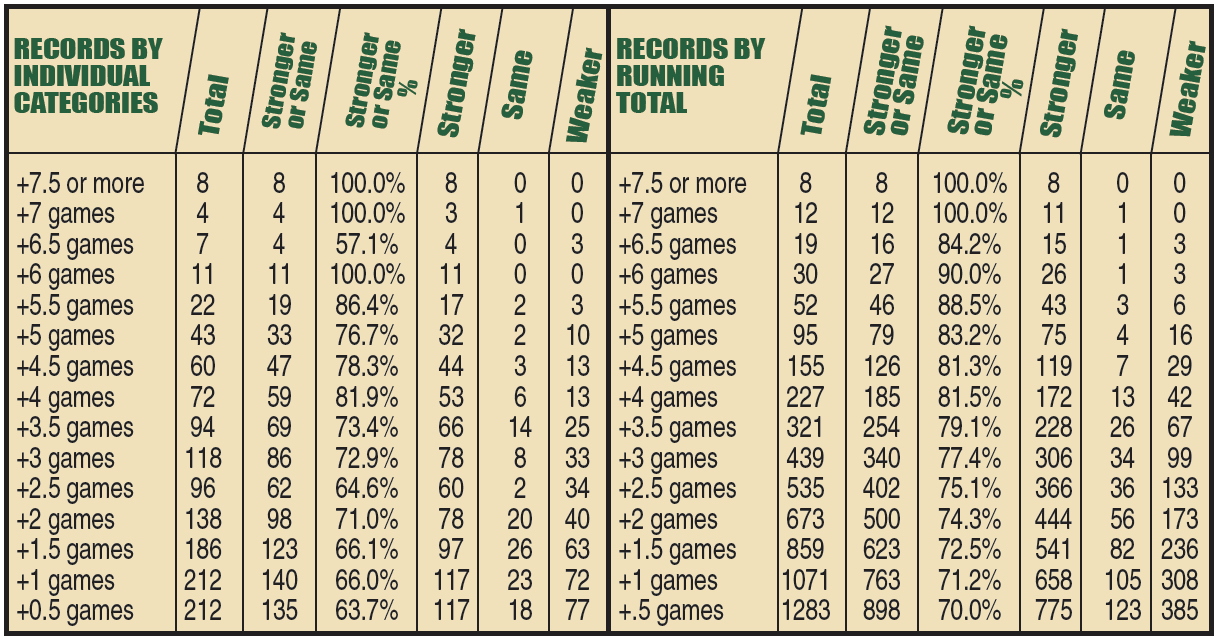
THE BULL MARKET: After several years I expanded my research to take a look back at all records since 1990 and the numbers were proven to be solid for decades. Since 1990 there have been a total of 30 teams that had a +6 Stock Market Indicator meaning that the prior year’s win total was 6 wins less than the average of the 2 years prior. Of those 30 teams, only 3 teams have had a weaker record, while 26 improved and 1 stayed the same. That improvement was dramatic going from a combined 84-272 (23.6%) to 166-199 (45.4%). Teams in the +5.5 category have improved their record 17 times had a weaker record just 3 times and the same record twice. There have been 43 instances of teams being +5 in the SMI category and those teams were 32-10-1 (76.2%). The records for +4.5 are now 44-13-3 (77.2%) and despite going down to +4 in my Stock Market Indicator, it surprisingly jumped back up to 53-13-6 (80.3%), which are superior to the individual +4.5 and +5 range. The numbers do drop back to 73.4% for a +3.5 net wins, 72.9% for +3 and down to 64.6% for +2.5. However, just when you thought the trend would get lower, surprisingly +2.0 has a 71.0% success rate. Even teams that had a +1.5 SMI from the prior two years, went up or stayed the same 66.1% of the time and teams that were either +1 & +0.5 combined for 64.9%!
Summing it all up, I will put it into 4 categories. Teams with a +6.0 SMI or higher are an almost perfect 26-3-1 (90.0%). Teams in the +4 to +5.5 range are 146-39-12 (78.9%) while teams in the +2 to +3.5 two-year SMI range are 272-131-43 (67.5%). Teams that were in the +.5 to +1.5 range are 331-212-67 (61%). Overall, of the 1,283 teams s/’90 that had a +.5 SMI or higher, 775 improved their record, and 123 had the same record meaning 70% of the time, teams in that category improved or had the same record.
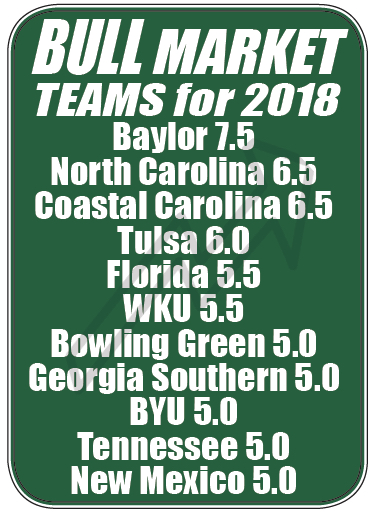
This year 4 teams fall into the top bracket of +6 or more on the two-year SMI. Also listed are teams with a +5 or more on my SMI.
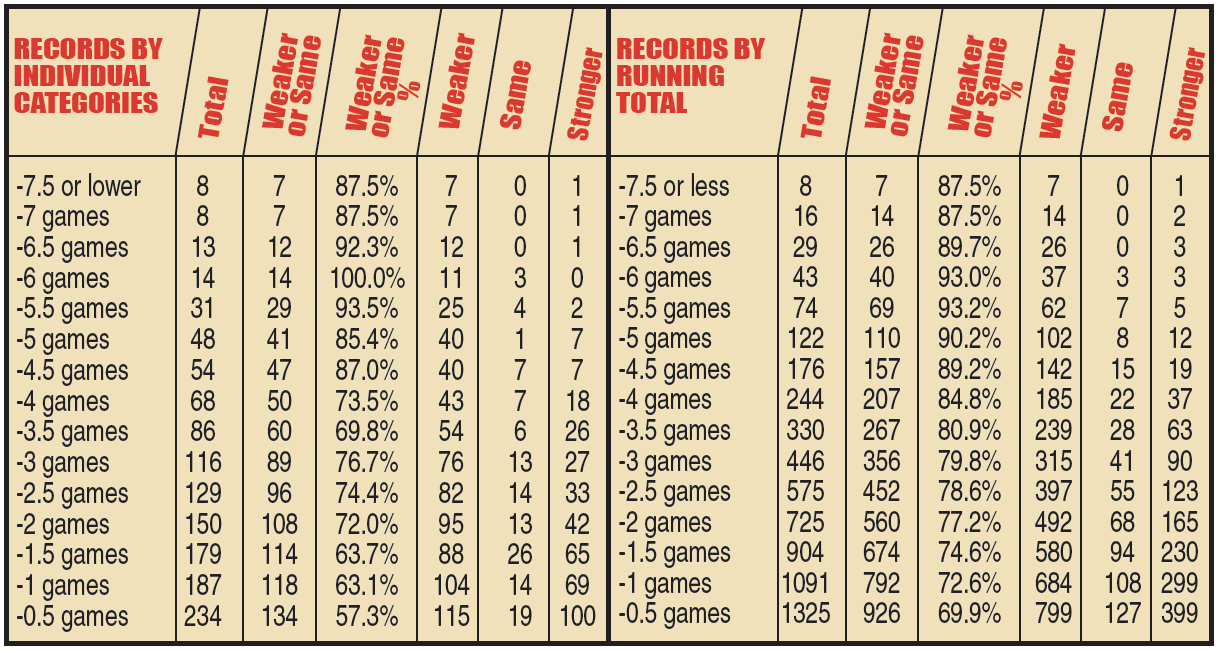
THE BEAR MARKET: Like all of my systems I put in my magazine, there is a two-way street to this Stock Market Indicator (SMI). I also have reviewed the numbers since 1990, on the Bear side of the market, teams with a negative indicator, indicating that a team had likely over achieved the prior season, and the numbers were similar to the Bull side. In fact of 43 teams that had a -6.0 SMI or lower since 1990, only 3 managed to improve their record. Troy was one of those rare exceptions last year going from 10-3 to 11-2. The biggest drop-offs came in 1998. Tulane had a -7.5 SMI and went from 12-0 to 3-8. Interestingly in 1998 I called for Washington St to go from the Rose Bowl to last place in the Pac-10, which they did and in the 2 year SMI they were -6.0 and went from 10-2 to just 3-8. Last year Tulsa was -6.0 and went from 10-3 to 2-10.
A look at the numbers shows a powerful trend of basically 77.3% if teams have a -2.0 SMI or less since 1990 have had a weaker or the same record the next year. Unlike the above positive Market Indicator, there were actually two teams that bucked the trend with a -7.5 or -7 and improved but overall the chart has higher percentages at the -6 & below level (37-3-3 92.5%). Teams that had a Stock Market Indicator of -5 or lower had a weaker or the same record the next year 90% of the time with 102 having a weaker record, only 12 with a stronger record and 8 having the same record. Even teams with a SMI between -3.0 to -4.5 were in a 75.9% category. The teams in the -2.0 to -2.5 Stock Market Indicator had a weaker or same record the next year 73.1% of the time. Teams in the -1 to -1.5 range had the same or weaker record only 63.6% of the time. Overall, teams that had -2 SMI or lower had the weaker or the same record basically 77.2% of the time.
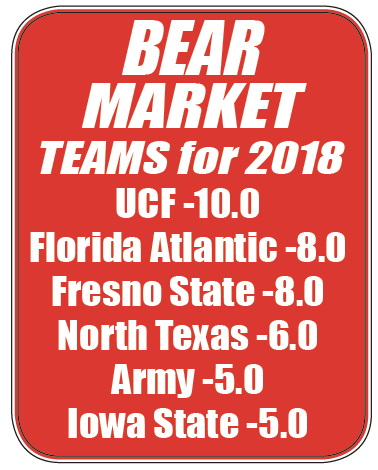
The last two years 18 years rated a -5 or higher (in the box of this article), and only 5 improved their record. Here are the 6 teams with a -5.0 SMI or lower including 5 at -5.5 or higher.
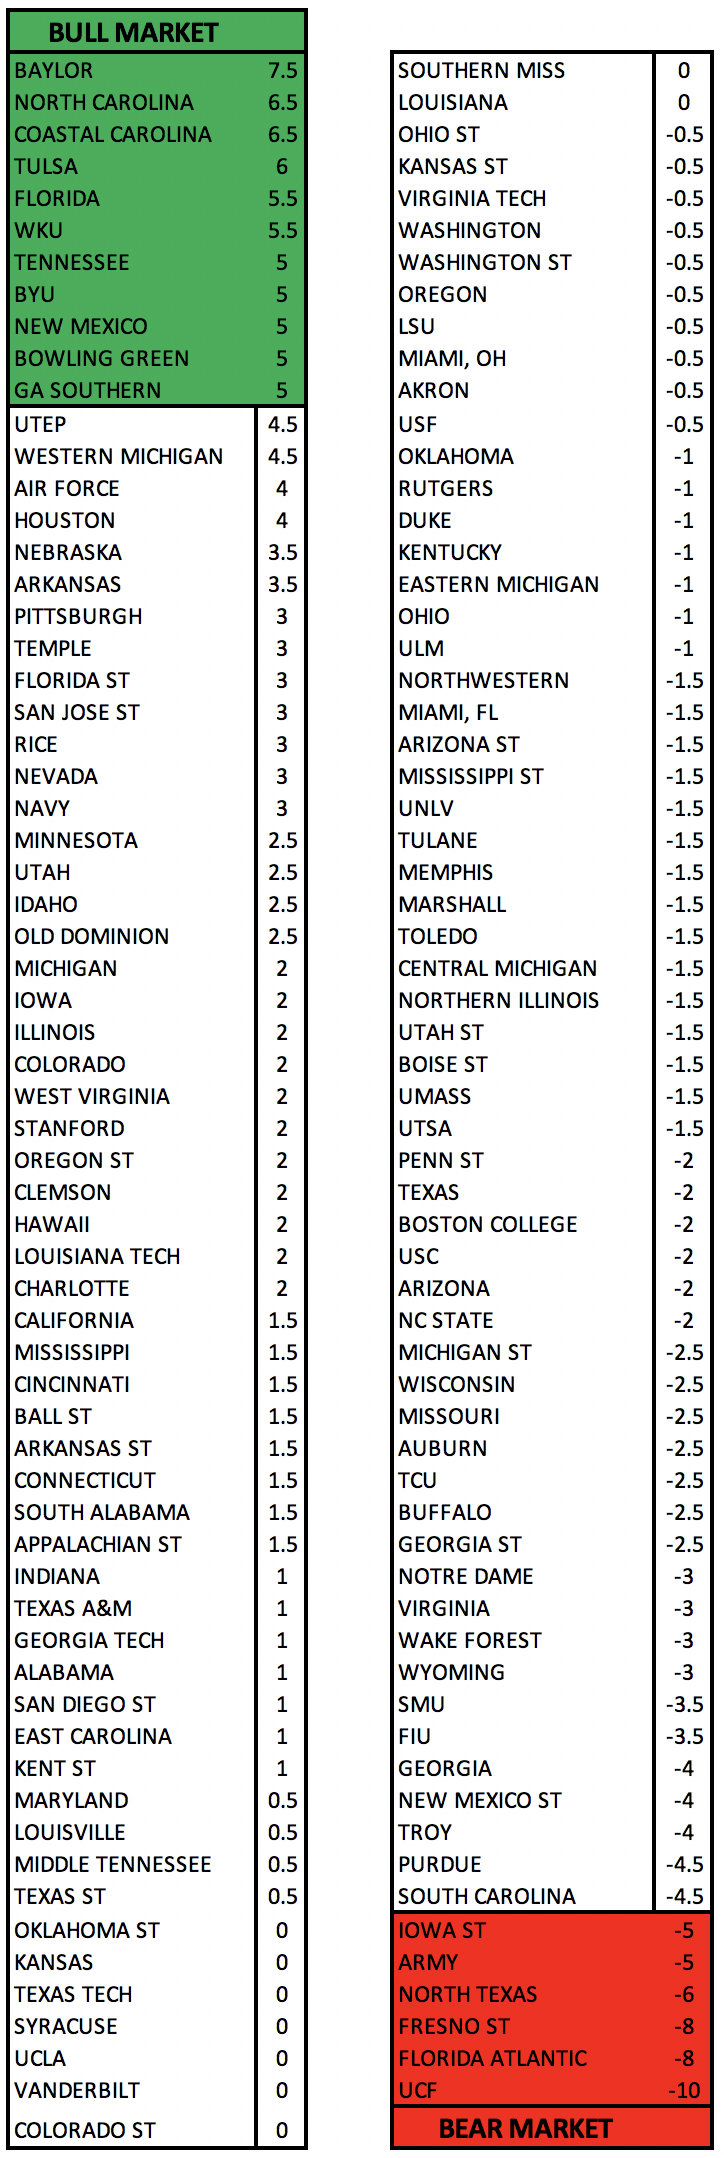
Here is the complete list of the Stock Market Indicator. Teams highlighted in green are the Bull Market. Teams highlighted in red are the Bear Market.