My very first article metrics article appeared in the first magazine in 1995 and it was Turnovers = Turnaround. That article had great success that year and has continued to do so over the 30 years of the magazine. It got me interested in doing many different metrics articles and now I have Close Wins/Close Losses, YPG Factor, YPP Factor, All Conference Points returning, Experience Chart, Experience Chart vs Last year Experience Chart, Draft Day Party Hangover, Stock Market Indicator, Tougher Easier Schedule and there are probably a few more that I am forgetting. My all-time favorite remains Turnovers = Turnaround.
In today’s blog I will start by giving you the actual article from this year’s FCS magazine. The FCS magazine is digital only but does have two full pages on every FCS team just like the FBS magazine. There are 118 FBS vs FCS games this year. Also, many casinos are posting lines on the FCS vs FCS games. Now back in the first years of my magazine I ran a Sports service and back then and my documented top play record was 9-4 in 1995 and 11-4 in 1996 using the information from my magazine. That is a sweet 20-8 71%. I bring this up because you can become an FCS expert for 2024 while the bulk of the country is still clueless about most FCS teams and you would have a big time advantage. If you would like to order the FCS magazine click here.
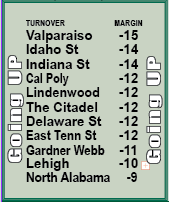
Now let me first of all give you the Turnover = Turnaround article directly from this years FCS Magazine
Let me give you an even deeper dive into the numbers. Here is a chart with the records for each category.
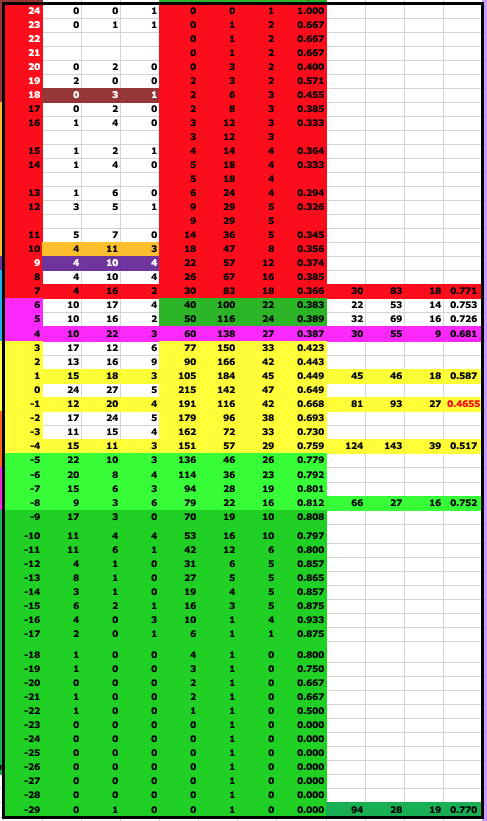
The first thing is that as good as this chart is, Presbyterian was -29 in Turnovers in 2021 but went from 2-9 to 1-10 to give the metric a loss at the very top. As you can see the chart highlighted in Green shows the success of the teams that had -9 or more Turnovers the previous year including a startling 17-3 for teams that were -9! As the chart shows I could easily have gone down to -5 as teams from -5 to -8 are at a 75.2% chance of having a better or the same record. Let me give you this year’s teams that are in the -5 to -8 Category
-8 Stony Brook, Murray St, UT Martin, Dayton, Miss Valley State
-7 North Carolina A&T, Northern Iowa, Western Carolina, McNeese St, Long Island
-6 Maine, Bethune-Cookman, Hampton, Holy Cross, Northwestern St
Teams in the -4 to +3 categories (see yellow on chart) are about a 50/50 proposition.
The +4 to +6 have a success rate of 68.1% of either having a weaker of the same record. Normally my chart has teams at +10 or more but as you see teams +7 or more qualify for the chart. In the article I have +8 or more in the Going Down Box and do list the ones with +7 or more at the end of the text.
If your team is not on this list they either become a subscriber to Phil Steele Plus or get the FCS magazine FCS magazine click here . Both have all the information you could possibly want on the FCS.