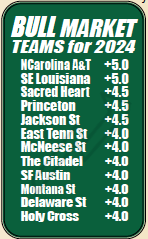
In today’s blog I will start by giving you the actual article from this year’s FCS magazine. The FCS magazine is digital only but does have two full pages on every FCS team just like the FBS magazine. There are 118 FBS vs FCS games this year. Also, many casinos are posting lines on the FCS vs FCS games. Now back in the first years of my magazine I ran a Sports service and back then and my documented top play record was 9-4 in 1995 and 11-4 in 1996 using the information from my magazine. That is a sweet 20-8 71%. I bring this up because you can become an FCS expert for 2024 while the bulk of the country is still clueless about most FCS teams and you would have a big time advantage. If you would like to order the FCS magazine click here.
Metrics, Metrics, Metrics. In 2012, I produced my first Stock Market Indicator article and it has delivered solid results each year. In 2012, Ohio St had a Stock Market Indicator (SMI) of +5.5, which would be a Bull Market. The +5.5 was calculated by taking their average win total from 2009-2010, which was 11.5 (11-2 in ’09, 12-1 in ’10), then subtracting their wins from ‘11 (just 6) which produced the +5.5. The Buckeyes clearly under performed in ‘11 and were poised for a big bounce back the next year (Bull Market). My Stock Market Indicator proved to be spot on as the Buckeyes were the Most Improved Team in the country going 12-0 in ’12! In ‘13, Auburn was coming off a 3-9 season following two years of going a combined 22-5. That earned them a +8 in my Stock Market Indicator and they got to the National Title game! In 2014, TCU was +5 in the Bull Market and went from 4-8 to 12-1 as the Most Improved Team in the country! In 2016, UCF was an amazing +10.5 in the Bull Market and improved
from 0-12 to earning a bowl bid. The last six years 78 teams have made the Bull Market box and 62 (80%) have improved their record! The Bear Market has also been a very accurate indicator. In 2019, 2021, 2022 and 2023 37 teams were in the Bear Market box and 32 (86%) had weaker records. Over the last 7 years 66 teams have made the Bear Market box and only 14 have managed to improve their record. The last 3 years there were 34 teams in the Bull Market box and 26 improved. There were 28 in the Bear Market and 23 were weaker, 49-7-6 overall!
Here is the Full Article
If your team is not on this list they either become a subscriber to Phil Steele Plus or get the FCS magazine FCS magazine click here . Both have all the information you could possibly want on the FCS.

