In my August 10th blog I detailed how happy I was with the results of the Experience Chart when used as a predictor for the upcoming season. Basically 70% of the Top 15 on the Experience Chart had an improved or the same record and 66% of the top 31. The results at the bottom of the chart were even stronger with 79% of the bottom 15 teams on the Experience Chart having a weaker or the same record the next year. Teams rated #90 or lower on the Experience Chart had a weaker or the same record 71% of the time!!!
I mentioned that I thought if you compared the chart to the previous year and looked for teams that made the biggest leaps or had the biggest declines in Experience that the numbers would be even stronger. I am pleased to report that yes, indeed the numbers were even better than I expected!!
Here is how I determined the numbers. I took where a team ranked the previous year in the Experience Chart. Let me give you an Example. In 2017 Georgia Southern was #127 on my Experience Chart and finished a poor 2-10. In 2018 It was a much more veteran Eagles squad that was #2 on my Experience Chart which was an improvement of 125 spots! Georgia Southern improved all the way to 10-3 in 2018! At the opposite end of the spectrum, we can look at the 2022 Nevada squad. In 2021 I was high on the Wolfpack, and they were #4 on my Exp Chart and went 8-5. In 2023 they were wiped out with defections and fell 125 spots to #129 on my Experience Chart and I had them picked much lower than most. Nevada went just 2-10.
Just like I did for the Experience Chart I ignored the 2020 and 2021 seasons as 2020 was an abnormal season with delays, reschedules and mismatched games due to Covid testing which had some teams down one third their players. In 2021 almost every team had everyone back and how do you compare records with 2020 when some teams played 4, 6 or even 0 games.
In 2023 the chart was solid once again. On the “Going Up” side Missouri improved 92 spots to #8 on my Experience Chart and not only had their first winning season in 5 years they ironically finished #8 in the AP poll at 11-2. At the other end of the spectrum East Carolina was #121 on my Exp Chart which was a drop of 103 spots after being #18 in 2022. The Pirates went from a solid winning year to just 2-10!
In 2024 Colorado was 85 spots better on the Exp Chart and went from 4-8 to a 4-way tie for the Big 12 title. Some teams at the bottom were Florida St (-71 spots), Michigan and Washington which both dropped 110 spots after playing in the title game in 2023.
Last year Miss St went from #105 to #9 on the Exp Chart and improved from 2-10 to 5-7 and even participated in a bowl. At the bottom Oklahoma St went from #1 to #108 and fell to just 1-11 and Northern Illinois went from #11 to #129 and fell from 8-5 to 3-9.
The first chart I will look at is now teams from 2012, 2013, 2014, 2015, 2016, 2017, 2018, 2019, 2022, 2023, 2024 and 2025 fared when they were much more experienced than the previous year. The example I mentioned above with Georgia Southern was the team that had the biggest difference. Example if a team was #100 in the Experience Chart the previous year and #50 this year they are 50 spots more experienced. Let me give you a few more Examples of teams that were much more experienced from one year to the next and how they fared. In 2016 Fresno was #110 on my Exp Chart but in 2017 Fresno improved to #25. That was a jump of 85 spots and their record went from 1-11 to 10-4! In 2013 Air Force was #93 on my Exp Chart and went 2-10 but in 2014 they jumped 70 spots to #23 on the Exp Chart and the record improved to 10-3! Florida Atlantic was #1 on my Exp Chart in 2017 (+67 spots) and their record improved from 3-9 in 2016 to 11-3!
Here is the chart for teams that were more experienced.
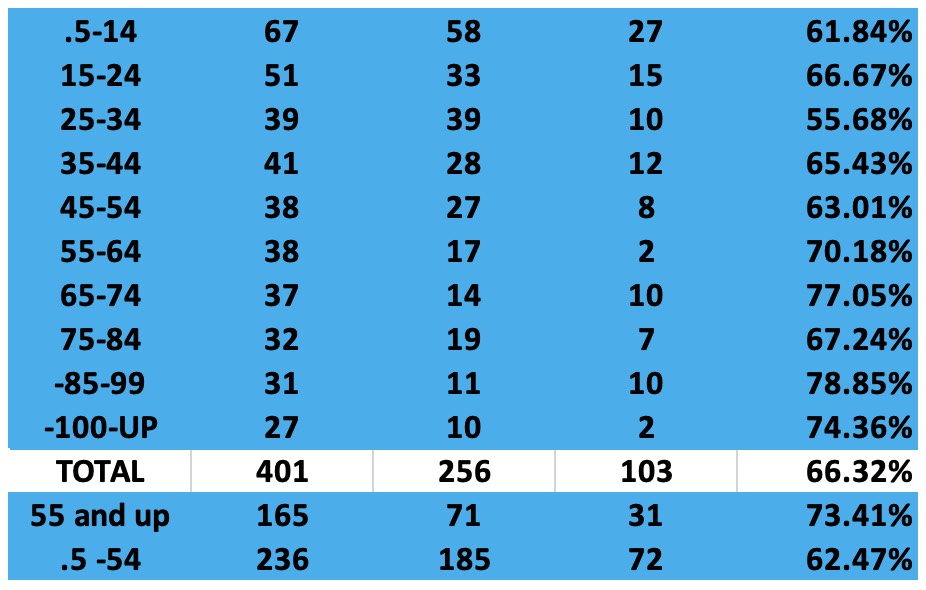
Teams that improved from .5 to 54 spots higher in the Experience Chart improved overall. There were 493 teams in that area and 236 improved their record while 185 had a weaker record which is 38% and 72 teams had the same record. As the chart shows above teams that are 55 spots more Experienced, or more than the previous year happened 267 times. Teams Improved their record 165 times with a weaker record only 71 times and the same record 31 times which is a success rate of 73.4% of teams having either a stronger or the same record! I will list the top of this year’s list below.
This second chart is how teams fared that were less experienced than the previous year. I listed the top example above, but this breaks down how each team fared in the different categories. This is the opposite of the above chart. If a team was #50 on my Experienced Chart the previous year and is now #100, they are 50 sports less experienced. In 2015 Michigan St was #34 on my Exp Chart and went 12-2 the next year they dropped to #117 on my Exp Chart a drop of 83 spots and fell to 3-9. Fresno St was 12-2 in 2018 when they were #24 on my Exp Chart but in 2019 fell all the way to #129, a drop of 105 spots and their record fell to 4-8. In 2021 Louisiana was #5 on my Exp Chart and had a remarkable year at 13-1 and were #16 AP. In 2023 they dropped to #97 a drop of 92 spots and were just 6-7.
Here is this year’s chart.
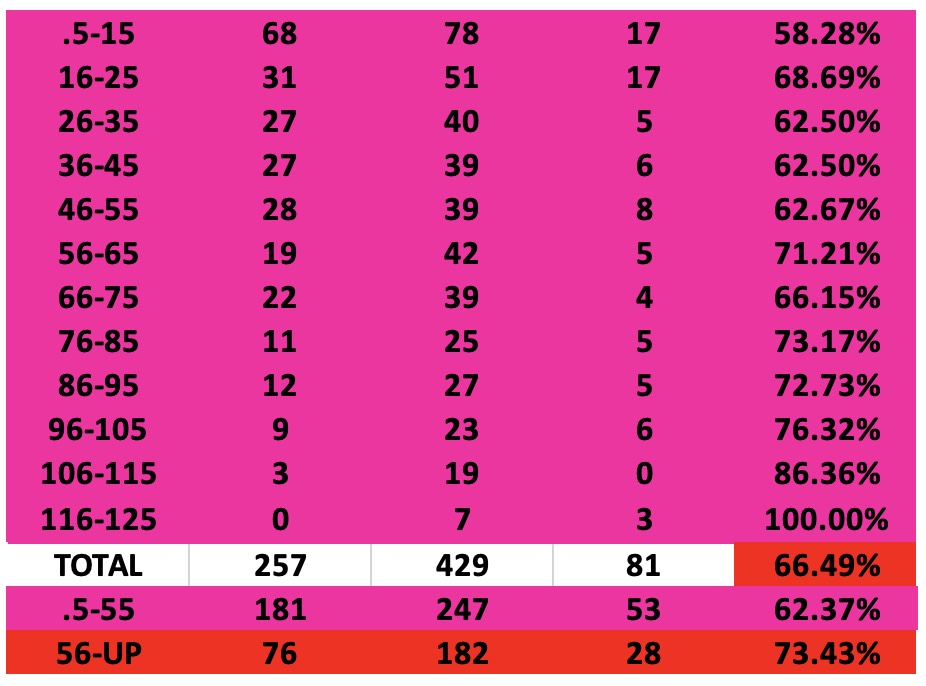
The results were similar in the opposite direction. As you would expect teams that were from 1 to 55 spots less experienced did indeed have a weaker record most of the time with 247 teams getting weaker and 181 teams having a stronger record. Good but that is only 63% with 53 teams having the same record. Once teams get beyond that 55 number the teams that have a weaker record really intensifies. Teams with over 55 points less experienced have a weaker record 182 times, a stronger record 76 times and the same record 28 times which is a 73.4% success rates of having a weaker or the same record!
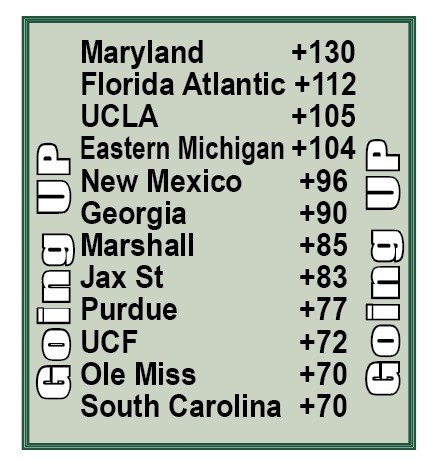
Now let’s take a look at some of this year’s top teams for these charts. In ’23 there were only two teams that improved their Experience by 100 spots or more and both had better records last year in Texas A&M and Wyoming. As you know the going up boxes in the magazine for all the Metrics articles have had Great success topping 80% the last 5 years! Here is the GOING UP BOX for More Experienced teams in 2026. (Todd make boxes)
GOING UP
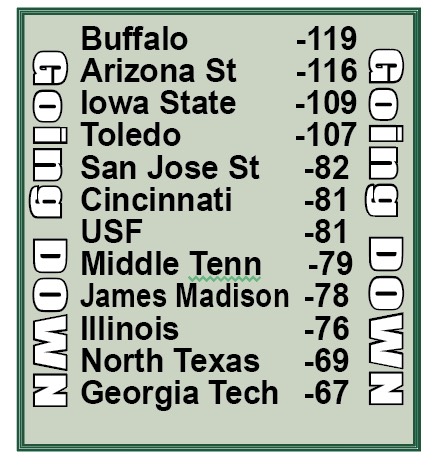
At the other end of the chart in 2023 there were five teams that topped a move of 100 spots weaker on the Experience Chart and are likely headed for a weaker year. Those five teams were Old Dominion (-110 spots), UAB (-104), East Carolina (-103), TCU (-101) and Stanford (-101). Four of the Five teams had a weaker record with Old Dominion the outlier. TCU went from playing in the National title game to a losing record! Last year there were five teams that topped a move of 100 spots weaker and Washington and Michigan who were both in the national title game were among them and went from a combined 29-1 to just 14-12 with both barely making a bowl game. This year there are seven teams that fall into that category.
GOING DOWN
Remember this year the magazine is EXCLUSIVELY sold at Barnes and Noble and Books-A-Million and will not be sold at any other retail spot. You can also buy the magazine direct here on the website and when you buy direct you not only get the physical copy mailed out but you will also get the digital magazine ($19 value) FREE. Here is a link to the store.
I have TWO FULL PAGES on EVERY FCS team and the digital FCS magazine is up right now and there are 126 games between FBS and FCS teams and you become an instant expert on each FCS Team CLICK HERE (use the code word MVFC at checkout and get $5 off!).
I have FOUR FULL pages on EVERY NFL team in my digital NFL Magazine which I just brought back this year, and it is up right now! CLICK HERE.
The price of Phil Steele Plus is just $99 for the entire year. This takes you thru the months of August, September, October, November, December, January and February. In those 7 months there are 32 weeks so that comes out to just a little over $3 a week. Right now, I am offering half off Phil Steele Plus to EVERYONE who purchased by 2026 College Football Preview magazine. If you purchased it online or thru our offices, then you can call 1-866-918-7711 and we will verify that you bought the magazine and give you a special one-time code. You then go to the Phil Steele Store CLICK HERE and when you put Phil Steele Plus in your cart at $99 then type in your special coupon code you will get $50 off and get the entire year for just $49 and that included a digital Phil Steele College Football magazine ($20 value, a digital FCS magazine ($25 value) and the digital NFL magazine! This comes out to just $1.50 per week for the entire year including access to the Schedule Predictor for the entire year! If you bought the magazine at Barnes and Noble or Books-a-million, naturally we cannot confirm your purchase online but have your magazine handy. Just call 1-866-918-7711 and one of my staff will have you turn to a random page and ask you a random question on that page. Once you confirm that you have the magazine in your hands, we will give you your personal code and you can go to the store and get the full year of Phil Steele Plus as well as both digital issues for $50 off and just $49. Phil Steele Plus is updated every day during the football season. Remember you get access to 138 FBS team pages, 128 FCS team pages, all 32 NFL team pages, the schedule predictor and tons of other football info!.
