If you look at last year’s magazine on page 28, I listed the All Conference points returning. I just went thru each of last year’s teams and updated the numbers. There were a couple of players that missed the season with injury or transferred out after the magazine went to the press. I have been doing the chart since 2009 and now have 14 years of research. I did not include 2021 as that year most of the players were back after the Covid year and it would have skewed the numbers.
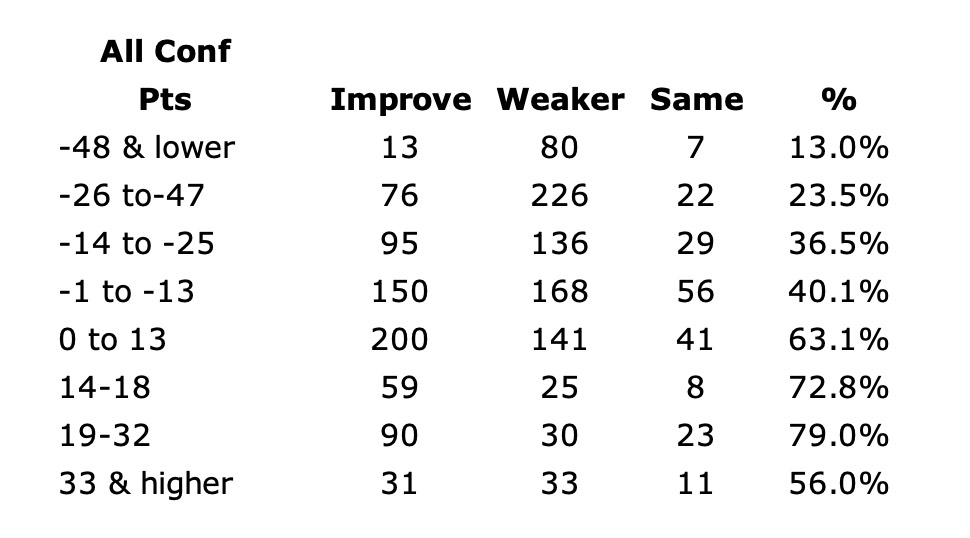
The results have been consistent including a result that goes against the grain but has done so consistently including last year. This metric looks at the All-Conference players returning and lost. I use the following point system: 10 points to 1st Tm All-Conf Player, 7 points to 2nd and 4 points for 3rd. If a player is an All-American, he gets awarded an additional 5. If you look in the blue column, you’ll see the positive number for more players back than lost. In ‘20 the the 8 teams with the most negative points (lost the most all-conf players) all 8 had a weaker record. Last year 7 of the top 8 had a weaker record with Louisiana having the same record. There were 21 teams that were -33 or more and of the 21; 17 had a weaker record, 1 had the same and only 3 teams managed to improve. Alabama improved from 11-2 to 12-2 and Oklahoma was coming off a losing season and was in almost every Going Up box in the magazine and improved.
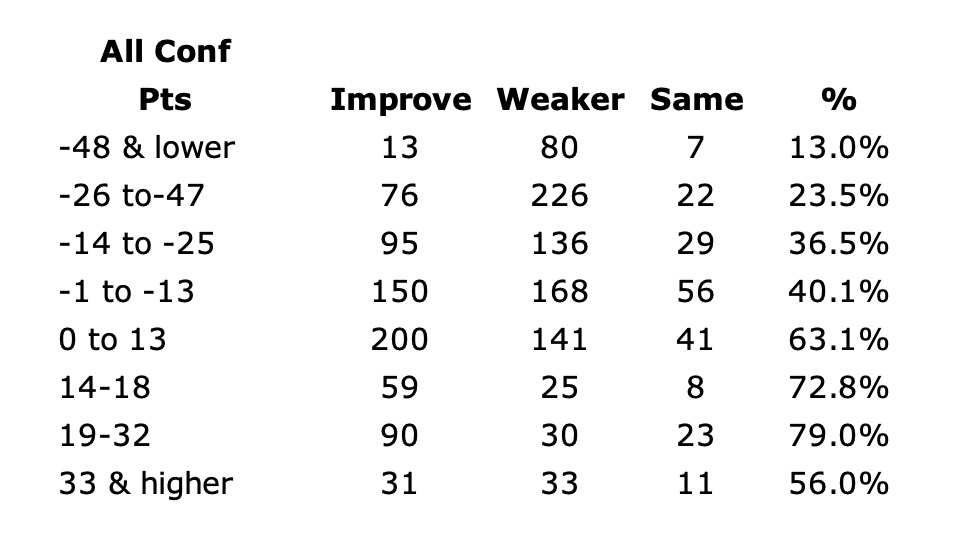
I have been doing this chart since 2009, so it has 14 years of research. There have been 100 teams that have accumulated -48 points or more and only 13 of them managed to improve their record (just 13%). When a team has between -26 and -47 points, they have only improved their record 76 out of 324 times (basically a 1 out of 5 chance). The surprising part is at the other end of the spectrum. Teams that return the most points (over 33 pts) have only improved their record 31 out of 75 times which is surprising. Other than that, the chart does what is expected. Teams that are between 0 and +32 have improved or had the same record 68.2% of the time. The best performing category is +19 to +32 points as only 30 out of the 143 teams had a weaker record the next year (1 out of 5). Teams in the +14 to +18 category have improved or had the same record 73% of the time and teams in the 0-13 range are at 63.1%.
I have thought of some different reasons for the teams that are 33 and higher to have about a 50/50 chance of having a better record but this is not an anomaly as it has remained true thru the years.
I have included the chart with the numbers below but make sure you check out my blogs each day on the All-Conference players returning and of course page 28 of the magazine when it comes out in June to get all the updated numbers. For teams in the negative category the % refers to the number of times a team improved their record. For the teams in the positive category, it including the number of times a team has improved or had the same record.

Last year the VIP deal worked out tremendously. All VIP members had access to the magazine two days after we sent it to the press, and they had EXCLUSIVE ACCESS to the digital magazine for two full weeks. The magazines were shipped priority mail to them as they rolled off the press and VIP members had the actual magazine in their hands about 3 weeks before it went on sale at Barnes and Noble. This year I have added a Super VIP in which you get two magazines, and I am giving away the full year of Phil Steele Plus access ($99 value) all for just $69 including shipping. Here is a link and we do send out the magazines on the FIFO method of First In (first ordered) First Out (first shipped). So right now if you order your magazine will be shipped on the first day but that window is closing fast. Also, I may change my mind on giving away a full year of Phil Steele Plus with the Super VIP order but it is available at least thru February.

