Today’s blog continues my in-depth look at my NCAA Experience Chart. For eight years I had listed an experience chart, which broke down the number of seniors, juniors, sophomores and freshmen each team had in the two deep and rated the teams experience level with a formula I devised. In 2009, I made the experience chart FIVE TIMES better by adding new categories like Career Starts on Offensive line, % of Offensive Yards returning, % of Defensive Yards returning and % of lettermen returning.
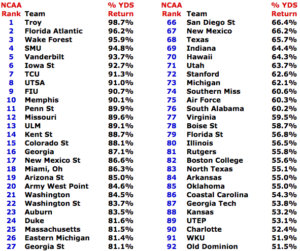
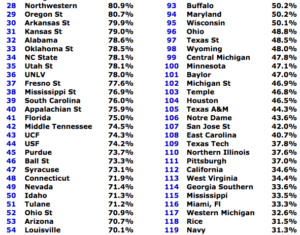
Today I will look at the % of yards returning. I took all of the yards each QB threw for as well as all of the individual rushing yards and receiving yards for each team. I then took all of the returning yards from 2016 and divided it into those for the percentage.
At the top of the chart is Troy. They return 8 starters from last year’s offense including their QB, top 7 rushers and top 7 receivers. They have 98.7% of their total yards returning from last year. They are followed by Florida Atlantic, who returns 9 starters on offense, their QB, top 4 rushers and top 3 receivers and 96.2% of their yards back. Other schools at the top of the list include: Wake Forest (95.5%), SMU (94.8%) and Vanderbilt (93.7%).
Last year the teams at the top of this chart were Louisville (8-5 to 9-4), Old Dominion (5-7 to 10-3), LSU (9-3 to 8-4), Georgia Southern (9-4 to 5-7) and SMU (2-10 to 5-7). Three of the top five improved their record while LSU and Georgia Southern did not.
At the bottom of the list of course is UAB. The Blazers (0.0%) is coming back after having no football program the last 2 years. North Carolina is next with 12.7%, Clemson (22.4%) and Nebraska (22.4%).
It is very interesting to note that defending national champ Clemson ranks low at #128 with 22.4% of their yards returning. Clemson has 5 offensive starters returning. They lose their QB, top 2 rushers and 3 out of their 5 top receivers.
I will be back Monday to take a look at another factor in my experience chart (% of tackles returning).


